The deceptively simple sentence that causes bad decisions
Imagine you run a small online shop that sells reusable kitchen containers. On Monday morning, an AI assistant summarizes last month's dashboard with a confident warning: “Product returns doubled, costing the business $1,100.” The owner immediately considers changing suppliers and stopping promotions. But what does the number actually represent? Some customers sent products back. Others received a goodwill shipping refund without sending anything back. Two orders were edited before dispatch, and a payment refund arrived days after the item was physically received. If the assistant grouped every negative transaction as a returned item, its story could be entirely wrong even when its arithmetic is tidy.
AI can be helpful here, especially when a small team lacks a dedicated analyst. It can explain the meaning of report columns, suggest possible checks and draft a short action memo. It must not invent missing records, assume every refund represents a defective product or silently change the shop's financial totals. Start with an agreed vocabulary, export real source data, then use AI only after the figures can be reproduced without it.
This workflow is separate from our weekly sales summary guide. That article is about the integrity of an overall sales narrative. Here the business question is specifically whether physical returns, refunds, cancellations and operational handling costs justify a product-quality investigation. It is also different from the reorder-point article, which concerns future stock decisions rather than returned merchandise.
Define the four different events before exporting anything
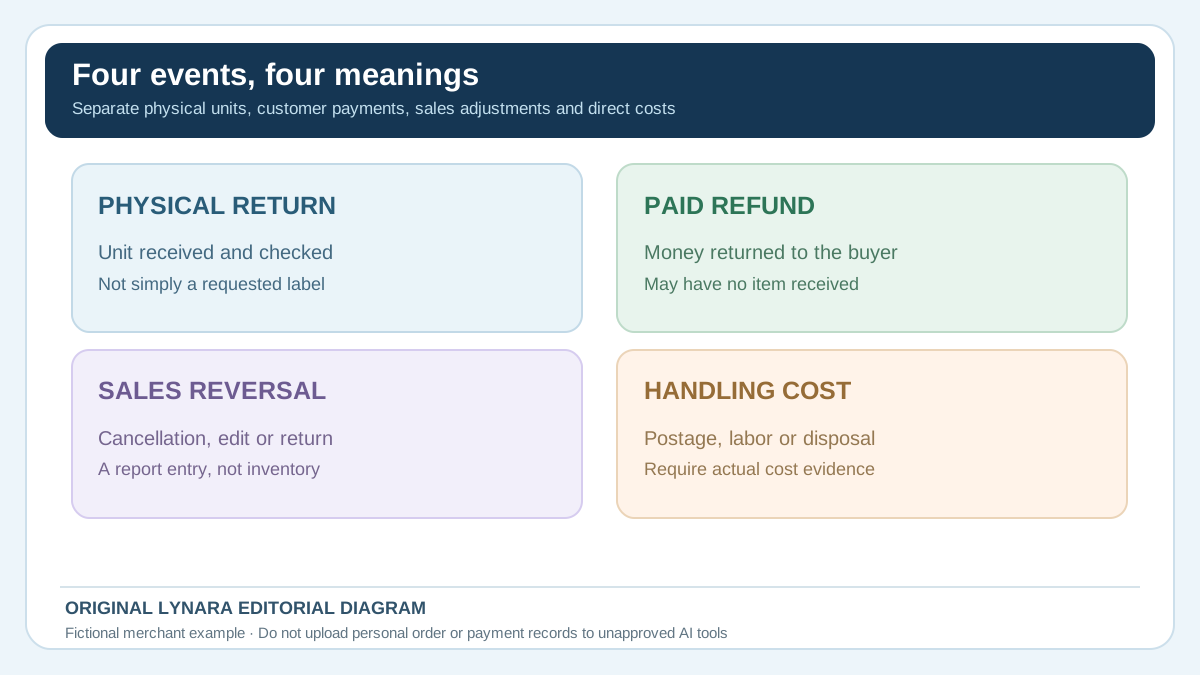
A physical product return
A unit comes back into the merchant's custody, or reaches the return processing stage defined in the source platform. You can count physical units for a given product cohort. You still need to inspect condition before calling them sellable. “Return requested” or “return label created” is not proof of receipt, and one return package may contain more than one unit.
A refund of money
Cash goes back to a customer. A shop may issue a refund for a late delivery, a pricing error, missing components or a courtesy concession without getting any item back. A partial refund can be lower than the original sale value. The payment event may occur in another week or month. Refunds are financial activity, not a substitute for a count of physically returned products.
A sales reversal or adjustment
Sales reporting systems can include order cancellations, edits and other reversals in negative sales figures. Shopify's current Sales Reports documentation separates Returned quantity for physically returned units from Reversed quantity, which also captures adjustments. Shopify retired the earlier, broader Quantity returned metric after May 1, 2026, so old exports and newer dashboards can have similar-looking labels with different meanings. If your shop uses a different platform, verify its field dictionary instead of importing Shopify's names into your own dashboard. The same English word may represent a different event in an accounting export.
An operational return cost
Postage, label costs, inspection labor and disposal can be real business expenses, but the supporting evidence sits in different systems. A carrier invoice may bill returns in batches. Staff handling hours may require a measured internal allocation. Some returned units will later be resold, repaired or written off. Do not treat a guessed resale value as cash received or subtract it from actual refunds without labeling the estimate.
Build a reproducible example using one cohort
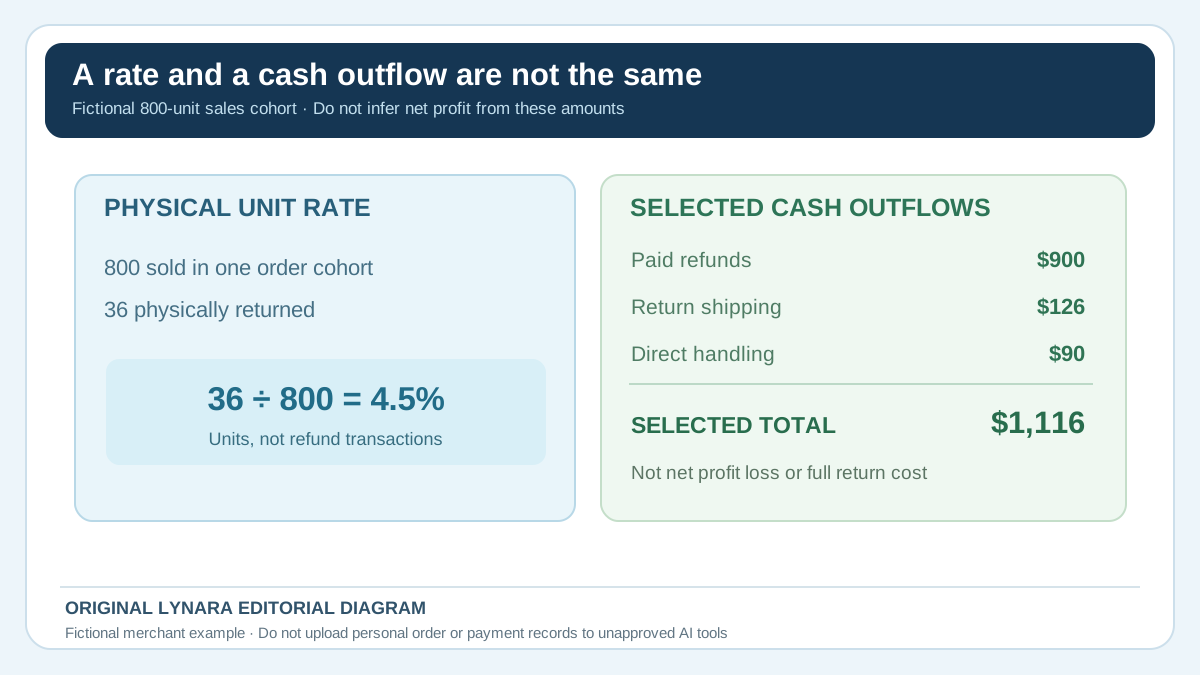
Suppose you sold 800 units of one product group in a clearly identified order cohort. After matching actual received returns to that cohort, you find 36 physically returned units. This makes the physical-unit return rate 36 ÷ 800 × 100 = 4.5%. If a customer bought two units and returned both, you count two units. If an order was canceled before shipping, that adjustment should not become a physical return just because it has a negative transaction line.
Assume the following small audit summary has been compiled from legitimate source records. Every amount is fictional, chosen solely to show the difference between events:
| Verified event group | Physically returned units | Refunds paid |
|---|---|---|
| Received, returned and fully refunded units | 24 | $600 |
| Received units with partial refunds | 12 | $100 |
| Goodwill price or shipping refund; no physical unit received | 0 | $200 |
| Total | 36 | $900 |
The shop also paid an illustrative $126 in return-shipping charges and allocated $90 of documented direct handling cost. The selected outflow categories total $900 + $126 + $90 = $1,116. Spread over the 800 sold units, that is $1.395, displayed as about $1.40 per sold unit. This figure is not net profit lost. It does not include product acquisition cost, packaging, restock value, tax adjustments, payment fees or potential resale proceeds. It simply answers: “How much did these specifically defined outflow categories add up to?”
Try the same arithmetic with the free Product Return Rate and Refund Outflow Reviewer. It runs locally in the browser and needs only aggregate numeric inputs. You can copy an audit brief for a teammate without entering customer names, email addresses, payment details or order IDs.
Use a five-stage verification workflow before showing an AI-generated trend
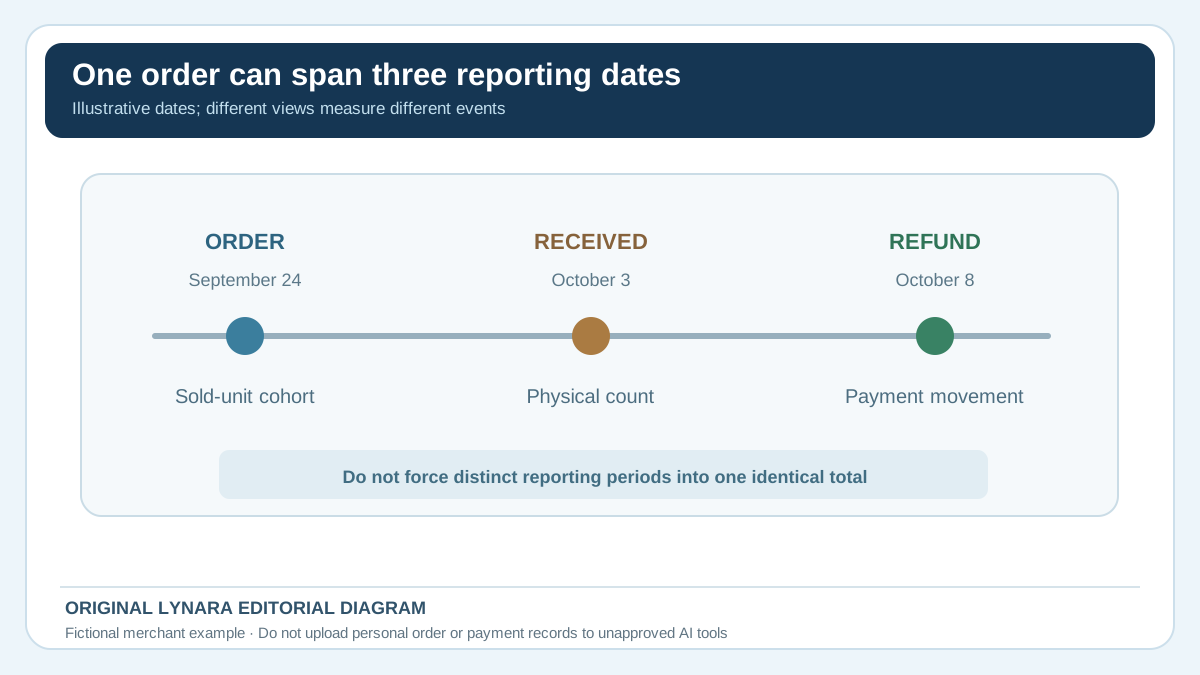
- Freeze your definition. Write “physical units received from orders placed in September” or another explicit cohort. Then choose whether the financial comparison follows order date, return date or payment date. Those periods may legitimately differ; disclose the difference instead of forcing false reconciliation.
- Export separate evidence. Pull ordered quantity by SKU, verified physical return records, payment refunds and actual carrier or handling charges. Use the same product identifier format and document the export time. Filter test orders and duplicates according to your source-system rules.
- Match identities and exceptions. Check whether one return is linked to an original sale, whether several units appear in one package, whether an exchange generated a new order, and whether partial or duplicate refunds were recorded. Do not overwrite an ambiguous row. Mark it for human investigation.
- Recompute without AI. Calculate physical returned units divided by sold units, with the denominator defined. Sum refunds and costs separately in currency, preferably as integer cents. Confirm totals against the payment processor and invoices. If two exports disagree, report both values and the reason still being investigated.
- Use AI for explanations, then approve manually. Give the assistant an anonymized, approved summary rather than raw customer data. Ask it to explain the observed pattern, list potential causes and identify missing evidence. A staff member reviews the output before supplier escalation, a new policy or a restocking order.
Shopify's sales discrepancy guide explains why the time a refund is processed and differences between sales, orders and payment views can change totals. Shopify also explains that sales reports and payments reports measure different events, so a refund processed in finance is not interchangeable with a physical return count. That is an excellent reminder to label dates on screenshots. A dashboard chart that reports refunds in the current month is not automatically measuring the physical return rate for the items sold in that same month.
A safer prompt for AI after the data is checked
Use a prompt along these lines with only aggregated figures your business is permitted to share:
We sold 800 units in a defined product cohort and verified 36 physically returned units, giving a 4.5% physical return rate. Separately, finance confirmed $900 in paid refunds, $126 in return shipping and $90 in direct handling costs. Do not assume every refund corresponds to a physical return. Summarize these numbers accurately, distinguish facts from hypotheses, suggest three operational checks and list missing evidence. Do not invent an industry benchmark, product defect rate, customer motive, future savings or supplier fault.
This is a writing aid, not an autonomous decision system. If the model declares “the supplier is defective” from the 4.5% rate alone, reject that conclusion. An unusually high rate for one item might involve packaging, incorrect size guidance, a misleading photo, a shipping problem or even a temporary data-entry error. Compare the correct product cohort over time and read verified return reasons before deciding what should change.
What to do when the report exposes a possible problem
Start with a manageable sample: inspect a handful of recent legitimate return cases, using staff access controls and a written reason code. Confirm whether the item was unused, damaged, wrong-sized, falsely described or simply no longer wanted. Review product photography and specifications. For a size-related issue, updating the measurement chart may help more than renegotiating with the supplier; for transit damage, inspect the packaging and carrier handling. Keep personally identifying information out of general AI prompts. If your team wants to use an AI vendor, first follow our vendor approval and client-data checklist.
Next, distinguish investigation from a permanent change. A return reason might be noisy or inconsistently selected by staff. Rather than launch a new returns policy immediately, choose one measurable hypothesis, assign an owner, and state the evidence needed to accept or reject it. One practical example is “the new container lid description causes confusion”: the team can compare actual reason codes and customer-support tickets, update factual product dimensions, and review a later cohort for a credible change. Without enough volume, avoid treating a short-term percentage difference as proof.
Finally, check what happens to physically returned inventory. Being received is not the same as passing quality inspection or becoming sellable again. Keep quarantine, repair, disposal and restock decisions separate. Our inventory reorder planner can help with verified on-hand and inbound figures, but only include recovered items after they genuinely qualify as stock. One double-counted return can distort both the purchasing plan and the returns report.
Keep a short evidence record your future self can understand
For each monthly review, save a note containing the product cohort, export source, cutoff date, sold-unit denominator, physically returned unit count, actual paid refunds, separately evidenced shipping and handling outlays, unresolved exceptions, reviewer name and next decision date. If AI helped write the explanation, record what aggregate data it saw and what the human corrected. This documentation is not red tape for its own sake: it prevents next month's reviewer from comparing different periods and announcing a false deterioration.
For a tiny business, a one-page review supported by real exports is more useful than an impressive automated dashboard that cannot explain its numbers. The outcome you want is a defensible next action: perhaps fix a product description, inspect a damaged batch, correct a report filter, or decide that the current sample provides too little evidence. AI can make that conversation faster; it cannot substitute for proof of what was actually returned and refunded.
Reference definitions: Shopify Help Center — Sales Reports and Shopify — Sales Discrepancies. The example is fictional, the calculations are explained directly, and platform terminology must be checked for your own store.