Inventory Reorder Points With AI: Check the Numbers
An AI assistant can write a neat “restock this product now” email in seconds. But if it counts reserved stock as available or assumes a delayed shipment is guaranteed, the recommendation can be worse than no recommendation.
The business problem is a stock decision, not a writing task
Picture a small shop that sells a particular reusable water bottle. The owner knows it sells steadily, but the next delivery takes nearly two weeks and a promotion is approaching. At the end of the day, the point-of-sale dashboard says there are 85 units on hand. A manager asks an AI assistant whether to reorder. The assistant responds with a confident yes or no, sometimes supported by a plausible table. The confidence is not evidence that it understood which bottles are already promised to customers or which supplier shipment will arrive on time.
The useful question is more precise: At what verified stock level should a human review a new order for this exact product variant? That is the purpose of a reorder point. It is a trigger for checking, not a purchase quantity, a sales forecast, or an instruction to spend money. Small-business owners who make this distinction can use AI to summarize evidence while keeping the actual calculation transparent enough to check with a spreadsheet and a calculator.
Start with one SKU or variant. A blue 500-milliliter bottle cannot be automatically combined with a green 750-milliliter model simply because both are listed as “bottles.” If the POS reports units sold by parent product rather than by variant, split those records before using any velocity number. Mixing packs, single units and different product sizes is a common way to create a mathematical answer that looks correct but is about the wrong item.
Build a small evidence sheet before prompting AI
For each SKU, collect the date range, units actually sold, cancellations, customer returns, inventory adjustments, current physical or system on-hand quantity, units already reserved or committed to orders, open supplier purchase orders and their confirmed expected dates. Keep the original export unchanged. Make a working copy in which a row means one well-defined event, and record whether an adjustment reflects a sale, a return to sellable stock, a damaged item or a stock count correction. Those events affect inventory differently.
Do not treat every negative line as a sale. A refunded order may or may not return a sellable unit to inventory. A warehouse transfer may reduce stock at one location while adding it elsewhere. A duplicate sales export may show the same payment twice. The assistant should flag these rows, not silently normalize them into a larger demand figure. Have a staff member who knows the POS system approve the definitions before computing averages.
A good field list includes a transaction ID, SKU, date, quantity, event type, location and a source reference. A second small table records purchase order ID, quantity, supplier, status, promised date and the last person who confirmed that status. Avoid uploading individual customer names, addresses or payment data when item-level quantities are enough. Use the same privacy and tool-approval controls you would for other business records; our AI vendor approval checklist explains why an apparently harmless spreadsheet can still be sensitive.
Calculate the reorder trigger from visible assumptions
A widely used starting formula is reorder point = average daily unit demand × supplier lead time in days + safety stock. Shopify's retailer guide to reorder points describes the same relationship and cautions that unexpected delays or changing demand require reevaluation. It is a planning model, not a universal guarantee that a business will never sell out.
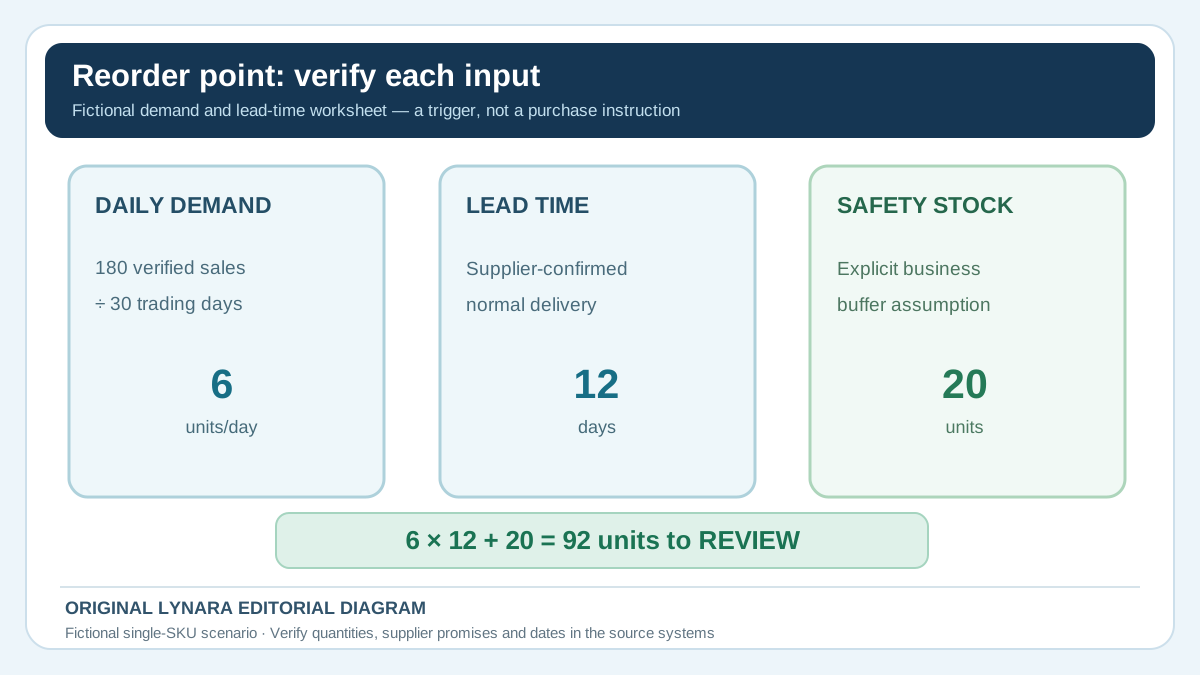
Assume our fictional shop has verified 180 sellable units sold over 30 relevant trading days. Its simple daily average is 180 ÷ 30 = 6 units. The supplier has confirmed a normal 12-day lead time, and the owner has deliberately chosen a 20-unit buffer based on prior disruptions and how painful a stockout would be. The arithmetic is 6 × 12 + 20 = 92 units. When the appropriate inventory position reaches or falls below 92, the shop should review whether to replenish.
This example is deliberately modest. Real demand can swing sharply by weekday, season, marketing campaign and product lifecycle. A single 30-day average can be wrong for a newly launched item or a limited-time promotion. Safety stock is not a magical percentage that works for every business; it is a decision about risk, cash tied up in inventory and variation in both sales and lead time. The more consequential the decision, the more attention the shop should give to these assumptions.
Use Lynara's free Inventory Reorder Point Planner to enter a checked daily demand, lead time, buffer, on-hand units, reservations and confirmed incoming units. The tool runs locally and exposes its arithmetic. It cannot determine whether an invoice, shipment or sales row is genuine, so the owner must validate those inputs first.
Worked inventory position: 85 units does not tell the whole story
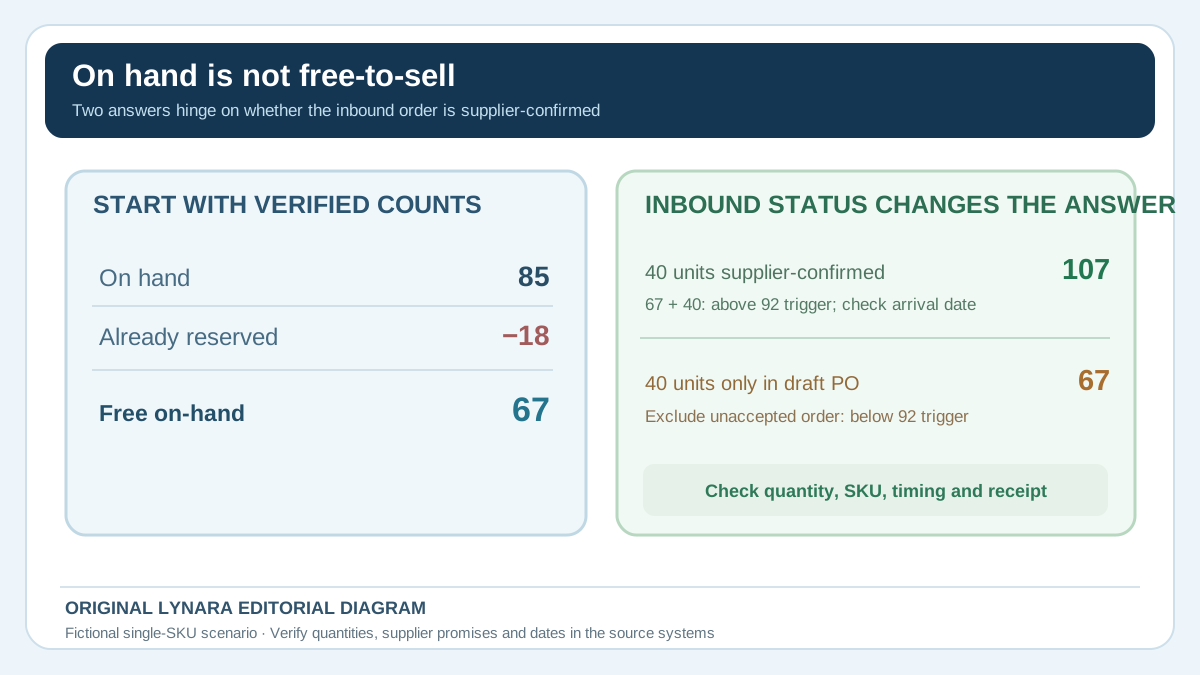
Return to the fictional water bottles. The stock system shows 85 units on hand, but 18 are committed to orders that have not yet left the warehouse. That leaves 85 − 18 = 67 freely available units. Another order of 40 units appears in purchasing records. The buyer has confirmed it directly with the supplier and recorded a promised receipt date. Under this simplified method, inventory position is free on-hand units plus those confirmed incoming units: 67 + 40 = 107.
Against a reorder point of 92, the inventory position is 15 units higher. On this arithmetic alone, the trigger has not been reached. But that result depends on the 40 units actually being part of a confirmed, usable incoming order and reaching the business in time. The formula does not model the hour or day the stock becomes available. If the promised truck will arrive too late to prevent a shortage, its presence in an inventory-position total should never be used to tell the owner that there is no risk.
Now change only one fact: the 40-unit line is a draft purchase order that the supplier has not accepted. It does not belong in the confirmed inbound field. The position falls to 67, which is 25 units below the 92-unit threshold. The owner should review a replenishment or continuity action immediately, but must still confirm prices, delivery and cash constraints. The difference between these two answers is not sophisticated AI. It is one verified status field.
The Shopify inventory reports documentation distinguishes on-hand quantities from items sold and days of inventory remaining. Its report definitions changed on October 1, 2026: newer inventory reports use On hand, including committed and unavailable units, while historical periods before that transition continue to use Available. Do not compare those differently defined historical and current columns as if they were the same measure. Other POS products can have different definitions. Write down which field and reporting period you exported before applying this simplified worksheet, and never subtract reservations twice if you already exported an available-to-sell quantity.
A confirmed purchase order can still arrive after the shelf runs dry
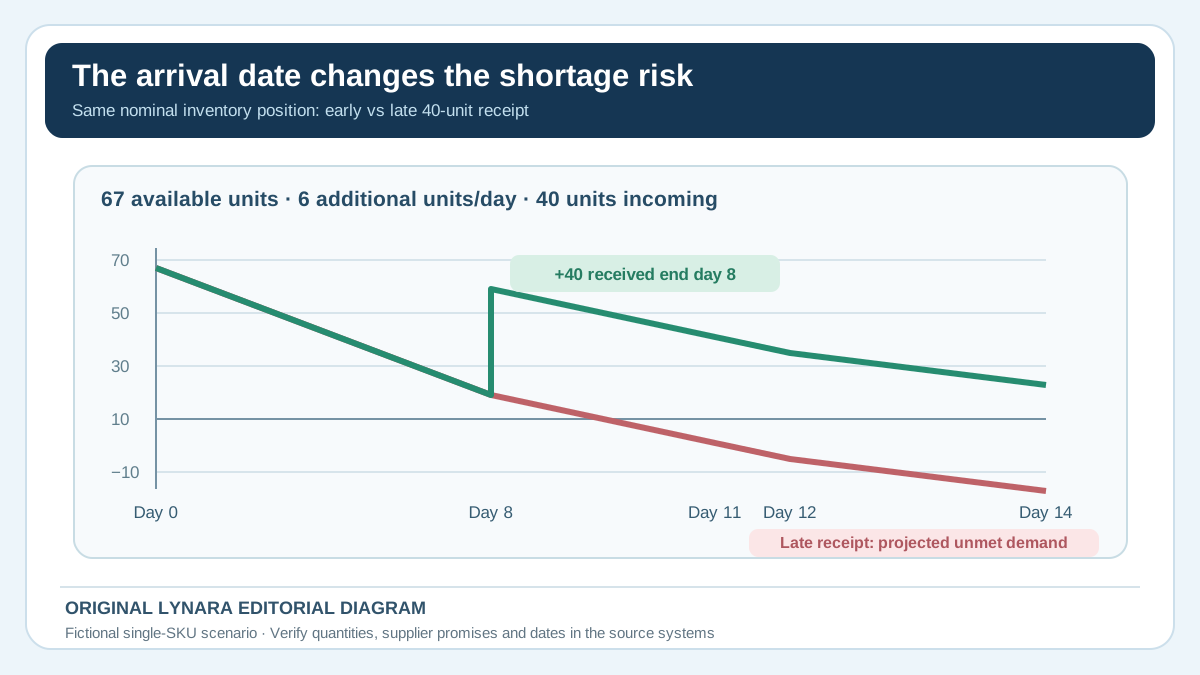
The earlier 107-unit inventory position includes a confirmed 40-unit incoming order, but that total contains no arrival calendar. Here is a stricter check using the same fictional bottle SKU: 85 physically on hand, 18 already reserved for existing customers, and therefore 67 units available for new demand. Assume new customers buy six additional units per day and a 40-unit delivery is expected at the end of day 14. Because the 18 already committed units have been removed from available stock, the six-per-day forward forecast must exclude those existing reservations; counting them again would double-subtract the same orders.
Without a receipt before then, the simplified balance after (d) days is 67 − 6 × d. Day 11 leaves one unit. Day 12 creates a five-unit projected unmet-demand gap (67 − 72 = −5). By the end of day 14, the modeled gap grows to 17 units (67 − 84 = −17). These negative values are not physical negative stock or proof of 17 completed lost sales: they indicate that the deterministic demand assumption exceeds what the shop can supply. Backorders, canceled purchases, substitution and partial orders will change what actually happens.
| Checkpoint | Receipt at end of day 14 | Receipt at end of day 8 |
|---|---|---|
| End of day 8 | 19 units still available | 19 before receipt; 59 after adding 40 |
| End of day 11 | 1 unit available | 41 units available |
| End of day 12 | 5 units of projected unmet demand | 35 units available |
| End of day 14 | 17 units of cumulative projected unmet demand before receipt | 23 units available |
Moving the confirmed receipt to the end of day 8 changes the operational answer: the business has 19 units left just before unloading, then 59 after accepting the 40 sellable units. Six days later, at the end of day 14, 59 − (6 × 6) = 23 units remain. Both schedules can show the same nominal inventory position of 107 at the snapshot; only one avoids the modeled shortfall. The precise delivery time matters, and the table assumes instantaneous availability after receipt, no defects, no other stock moves and constant demand.
For a real purchase decision, ask the supplier for the accepted order number, item variant, quantity, delivery window and any partial-shipment conditions. Compare the first date when new demand may exceed uncommitted stock with the earliest date usable inventory can arrive. A shipment that is merely in transit is not necessarily available to sell. If a gap appears, an owner may need to expedite a smaller order, offer a transparent customer delay, check a substitute or revise a promotion. Do not let an AI assistant silently classify a late delivery as sufficient stock.
Make a simple audit record with columns for SKU, stock-count timestamp, on-hand units, existing reservations, forecast demand per day, accepted purchase-order ID, promised receipt date, expected usable units, projected first shortage date and reviewer. Keep transaction-level customer details out of the AI prompt. This short timeline is a complementary check to the Inventory Reorder Point Planner, not a claim that a single daily-average formula can forecast a real retail calendar.
Ask AI to identify missing facts, not invent them
A safe prompt for an approved business tool is: “Using only this anonymized, checked SKU sales table and the supplier lead-time records, list the exact source rows for average daily demand, committed units and confirmed incoming purchase orders. Mark missing or contradictory fields UNKNOWN. Do not invent safety stock, delivery dates or an order quantity. Show the reorder-point formula separately from a human purchasing decision.” This makes the assistant's task clear and gives the reviewer something to test.
Check at least three high-impact facts manually. First, is the sales period representative, and did the model count net valid demand instead of every transaction row? Second, do on-hand and reserved quantities refer to the same physical location and snapshot time? Third, is the inbound order confirmed, and does its delivery date fit the expected depletion window? If the AI loses the source row for any of these, its recommendation should be downgraded to an unanswered question.
Use the AI Claim Verification Tracker to record a claim such as “40 confirmed units arrive this week,” along with the purchasing-system record and the person who independently checked the promise. A model's wording, even when it includes a citation, is not a substitute for evidence. If you need a spreadsheet-level check, our business spreadsheet verification guide covers raw tabs, data dictionaries, formulas and source-based review.
Stress-test the answer before acting
One sensitivity check is especially revealing. Suppose a promotion lifts average daily demand from 6 to 8 units while the supplier lead time and chosen buffer stay the same. The reorder point becomes 8 × 12 + 20 = 116 units. The previously comfortable inventory position of 107 is now nine units below the threshold. No shipment changed; only the sales assumption did. That is why stock triggers should be revisited when a promotion, school term, holiday or local event is likely to change purchasing behavior.
Another check is supplier delay. A 12-day lead time is useful only if it reflects current supplier performance. If an important order might require 18 days, the equivalent threshold at six units per day and 20 units of safety stock becomes 6 × 18 + 20 = 128 units. The right response is not necessarily to increase safety stock for every product indefinitely. It may be to confirm a faster alternative, lower promotional commitments or negotiate more reliable delivery for critical items. The business must judge the cost of holding inventory against the cost of disappointing customers.
Some stock requires different treatment entirely. Perishable goods have expiry risk; fashion products can lose relevance; custom items cannot necessarily be resold; and a one-off event may create demand that never repeats. Use a reorder-point trigger as an early question, not an automatic decision for every SKU. A tool that says “review this item” can be more valuable than a tool that confidently orders inventory you cannot sell.
Separate the reorder trigger from the purchase decision
Even if the threshold has been reached, you still need to decide how many units to buy, from whom and under what terms. The reorder point does not answer that. A supplier may require a minimum of 300 units while the shop needs a much smaller quantity. Two vendors may quote different shipping fees or lead times. A bulk price discount can make the unit price look better while increasing the upfront cash obligation and shelf space required.
Use Lynara's Supplier Quote Comparison Checker to compare written offers with minimum orders, unit price, shipping and setup fees. It flags unverified offers and separates the amount you have to purchase from the amount you actually need. Have a human confirm delivery, exact product specification, payment instructions and authorization. The purchasing manager's final approval should be recorded outside the AI answer.
If your goal is to determine whether an AI assistant saves employees time on weekly stock reviews, measure the full workflow: exporting data, correcting rows, checking supplier statuses, calculating triggers and reviewing the proposed action. Use the Business AI ROI Calculator with measured time savings and real software costs. Do not label a product-price discount as an AI productivity saving unless you have evidence the workflow caused the result.
A reusable weekly stock-review routine
- Select a specific SKU and location; document whether quantities mean units or packs.
- Export the current sales period and preserve the untouched source file.
- Exclude or classify cancellations, returns, transfers, damage and duplicate rows with a documented rule.
- Calculate average daily demand and check whether seasonality or promotion makes it unrepresentative.
- Confirm current lead time from a real supplier record and choose an explicit safety-stock assumption.
- Reconcile on-hand, reserved and independently confirmed inbound units using consistent definitions and dates.
- Calculate the reorder trigger and stress-test at least one sales or lead-time change.
- If the trigger is crossed, obtain comparable written quotes and authorize a purchasing decision through the proper controls.
This is intentionally less glamorous than one-click “AI inventory automation.” For a small business, the useful gain is a repeatable decision that staff can explain and that does not silently spend money when a source field is wrong. Once that process works manually, the business can decide which clerical parts deserve automation and which approvals must remain human.