AI for Excel and Google Sheets: Small Business Audit Guide
Turn AI-generated charts and formulas into numbers a colleague can independently verify.
AI in spreadsheets is a calculation assistant, not an audit
Small businesses often maintain revenue, inventory, hours and client tasks in Excel or Google Sheets. AI assistants can suggest formulas, organize tables, generate summaries and surface questions that a person might miss. They can also misread a column, overlook a filter or produce a convincing explanation for an incorrect total. Microsoft's Copilot in Excel FAQ directly warns that generated insights and formulas may be inaccurate and should be verified. The useful question is not “Can AI analyze this sheet?” but “Which checks will reveal whether its answer is reliable?”
Keep a raw source tab and a separate working copy
Imagine a freelancer tracking 100 project invoices. The original export might contain blank payment dates, duplicate invoice IDs and some amounts as text. First retain the raw file unchanged with its export date and source. Create a working copy for cleaning and make notes of every transformation. If AI suggests deleting rows, do not accept the operation before understanding why those rows were selected. A source tab that never changes allows you to reproduce results or recover from a mistaken formula. Business decisions need that traceability as much as university research does.
Make a data dictionary with meaningful columns
A label called “Total” might mean the sale before tax, the amount owed, revenue after refunds or the invoice total. Before prompting a model to compute gross sales, define what each field actually represents, its units, whether it can be blank and how missing values should be treated. A useful data dictionary includes field name, meaning, allowed type, example value, uniqueness expectations and owner. In a stock list, distinguish item ID, item name and location; in a time sheet, distinguish hours billed from hours actually worked. AI cannot infer undocumented business policy from a tidy header.
Use our local CSV checker for structural problems
Lynara's Research CSV Quality Checker can flag missing fields, duplicate rows, inconsistent column counts and potentially mixed number/text entries in a small local CSV sample. Despite its education-oriented name, those checks can support an authorized business export too. It does not upload the data to an AI model and does not change rows automatically. Local-only processing is not permission to handle restricted customer or employee records. Use synthetic or approved non-sensitive data and follow your company's rules. A clean structural report does not prove that every invoice amount is financially correct.
Try a five-row CSV quality check without exposing client data
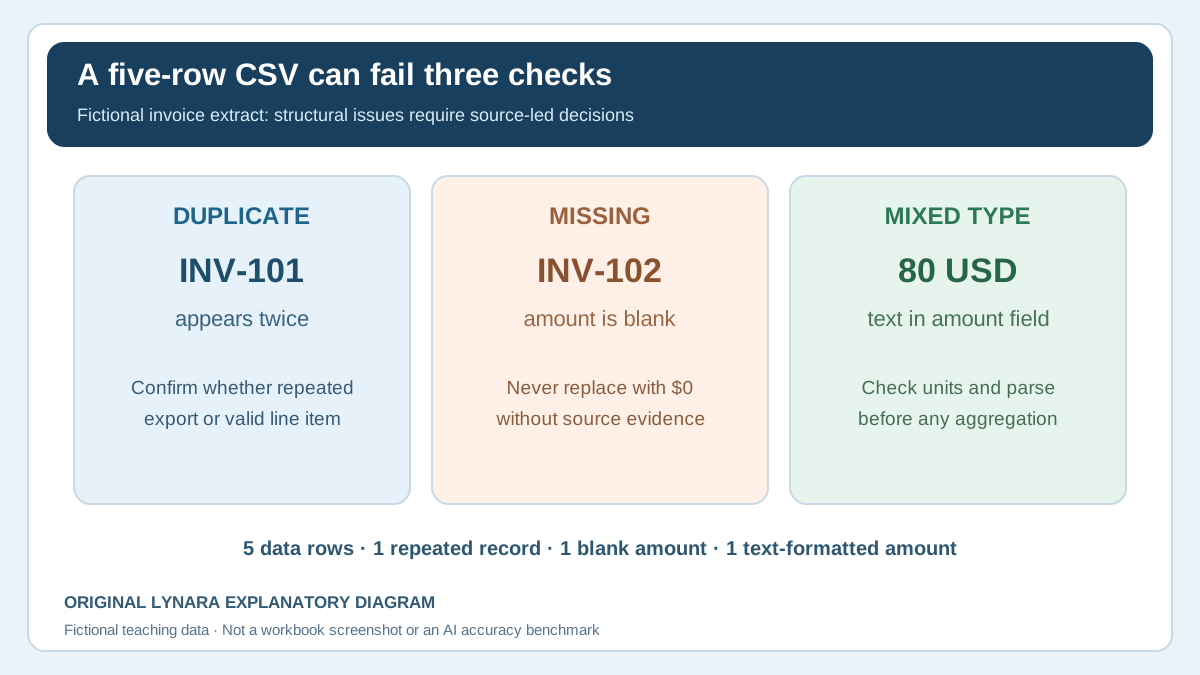
You can reproduce the structural checks before using any real business export. Copy this entirely fictional invoice sample, including the header, into Lynara's local CSV Quality Checker. The tool works in your browser; this example contains no personal data or actual invoices.
order_id,amount,status
INV-101,120,paid
INV-102,,open
INV-101,120,paid
INV-103,80 USD,open
INV-104,95,open
Inspect the results for five data rows, one exactly duplicated row, one missing value in the amount column and the text-formatted value 80 USD. Depending on the checker version and its supported checks, not every type inconsistency may produce a separate warning; confirm the data directly. No row has an incorrect number of columns in this fixture. The tool does not decide whether the duplicate is a second legitimate line item or a mistaken repeated export; both possibilities require the business's actual order ledger to resolve.
- Run the sample unchanged and confirm these flags before testing your own data.
- Record the source, export time, column definitions and reason for each later adjustment in a separate change log.
- For the blank amount, consult the authorized invoice source; do not substitute zero simply to clear the warning.
- For
80 USD, decide whether the unit belongs in a separate column and normalize values only after verifying the original record. - For the duplicate invoice row, check identity and transaction purpose before removing anything.
This is a repeatable format-checking exercise, not an AI prediction, fraud detector, accounting reconciliation or authorization to upload restricted business records. A clean file can still contain inaccurate prices or transactions.
Example: a simple business sales table
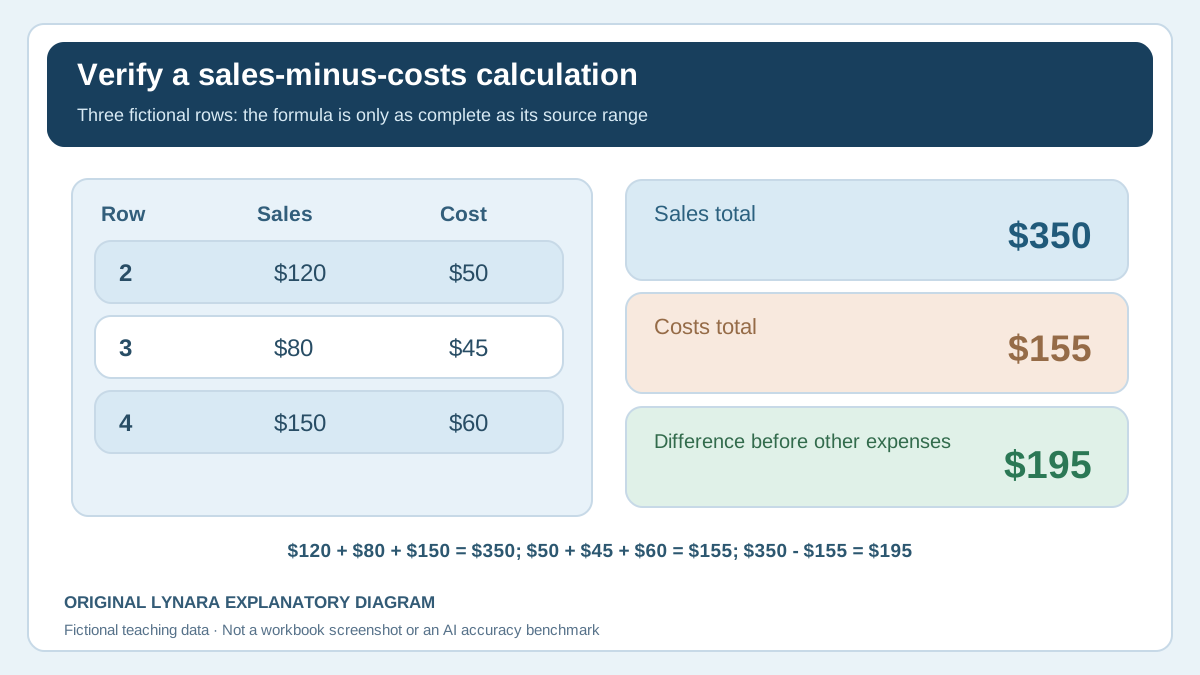
Consider a fictional three-row table with sales of $120, $80 and $150, and associated costs of $50, $45 and $60. Sales total $350; costs total $155; the difference is $195 before other expenses and tax. A model may generate the formula SUM(B2:B4) for revenue and SUM(C2:C4) for costs, but the owner must verify the actual range and which rows are included. If the spreadsheet has an unobserved fourth transaction below the selected range, a perfectly valid formula is still answering the wrong question. This example is made up to illustrate auditing, not a claim about typical margins.
A specific prompt is better than a vague request
Instead of “Analyze my business spreadsheet,” write a task instruction that identifies the approved table and desired output without exposing unnecessary data. An example for synthetic data: “In the sample table, check the three monthly sales amounts in column B and costs in column C, show the exact cells used, calculate sales minus costs, and list any missing or duplicate invoice IDs. Do not change the original sheet.” The instruction should request visible intermediate numbers. Model responses still require an independent calculation or sheet formula. The goal is a checkable result, not merely an elegant paragraph.
Understand Excel Copilot and Gemini availability
Microsoft documents that Copilot in Excel supports prompting with specific columns and ranges, while Google's Gemini in Sheets guidance describes table creation, formula assistance and charting for eligible accounts. Capabilities, plan eligibility and supported languages can change. A product page is not an independent assessment of accuracy and cannot establish that your organization's settings permit a feature. Before relying on either, confirm the active subscription, region, tenant permissions, workbook type and approved data handling.
The most common formula failure modes
Formula errors can be syntactic or semantic. A divide-by-zero message is obvious, but a silent reference to the wrong cell is not. Other traps include absolute-versus-relative references, hidden rows, filtered views, comma-versus-period number formats, mismatched date systems, duplicate keys and lookups that silently pick the first match. Microsoft's formula error guidance explains investigation tools for spreadsheet faults. Ask AI to explain a formula in ordinary language, then test it with known examples and boundary cases instead of blindly pasting it down a column.
Check generated charts as carefully as formulas
An AI-generated graph may hide the distinction between sales amount and transaction count, use inconsistent units or display two categories with very different sample sizes as equivalent. Verify axis labels, time windows, denominators and how missing periods were handled. If a dashboard uses a line chart for monthly revenue, check that the dates are in chronological order and the aggregation is appropriate. Our Chart Axis and Denominator Checker can inspect a simple user-entered comparison, but it cannot audit an entire dashboard or infer the true denominator from a screenshot.
Privacy and access in shared workbooks
An authorized spreadsheet may still be too sensitive for a public AI application. Customer names, pay, banking information and vendor contracts can be restricted by agreements or organizational policy. Check data classification and vendor terms before using any assistant, even when the assistant is integrated into a familiar office suite. Microsoft's documentation warns that edits inside a shared workbook may be visible to others with access. Use separate test copies or a controlled workspace to prevent unreviewed changes from appearing in a report others will rely on. Ask administrators for approved options rather than improvising with personal accounts.
An inventory example that exposes a bad join
A fictional inventory sheet has two products named “Cable,” one identified as CAB-A at $6 and another CAB-B at $19. A lookup using product name alone could return the wrong price. An assistant might suggest a formula that looks plausible yet matches the first “Cable” row for both purchases. Use stable item IDs and verify that the join key is unique on the table where uniqueness is required. Include test records that have duplicate descriptions but different IDs. The result is not evidence of a model being generally bad; it shows why a business data design matters before automation begins.
Measure whether AI preparation really saves time
The most realistic automation candidate is often a narrow reporting chore, such as transforming a weekly anonymized order extract into a consistent summary. Measure manual preparation minutes, AI-assisted transformation minutes and human validation minutes, and log correction rate. Enter those observed inputs in the Business AI ROI Calculator. It includes subscription and setup expense instead of valuing only the draft generation time. If reviews take longer than the time supposedly saved, the workflow is not financially attractive under those assumptions even if the chart looks impressive.
A safe rollout checklist for finance-adjacent reports
Keep raw data immutable; define each metric; validate formulas against small known examples; review filters, grouping and missingness; inspect the output's units; have an authorized person sign off on consequential decisions; and preserve the actual evidence behind each report. Never treat a confident AI explanation as a professional accounting, legal or tax opinion. In regulated or materially financial use, obtain appropriately qualified review. A trustworthy process deliberately preserves the ability to say “We cannot establish that from this sheet,” which is often more valuable than a fabricated numerical answer.
For any live finance-adjacent spreadsheet, preserve a reviewer name, the version of the input extract, the formula or query used and the date of approval. A report that cannot be reproduced should remain a draft even when every displayed cell looks plausible.
Audit an AI-generated percentage before publishing it
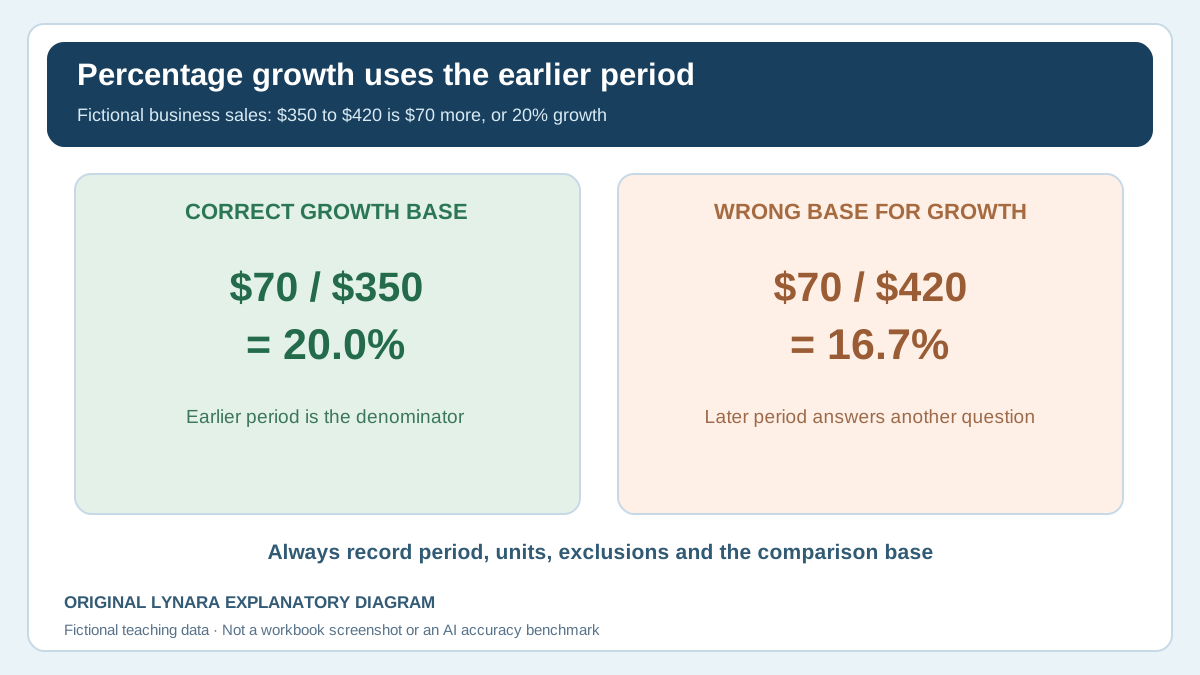
Suppose the same fictional company reports $350 in sales in one period and $420 in the next. The absolute increase is $70, but the percentage change is (420 − 350) ÷ 350 × 100 = 20%. A model might instead divide by $420 and report 16.67%; the arithmetic is valid for a different denominator, but it does not answer the usual percentage-growth question. For any generated KPI, write down the original inputs, the relevant comparison base, the time window, exclusions and units. If the original period is zero, standard percentage growth is undefined rather than infinite in a meaningful business-reporting sense.
Check both positive and negative examples, especially refunds, zero months, partial weeks and dates around a reporting cut-off. A human reviewer should approve the meaning of the metric before it appears in client-facing or management reporting. The chart-axis checker can help explain selected denominator effects, but it does not determine which business metric is appropriate.
A release decision: what to do when the numbers look plausible
Imagine a shop owner wants to email a weekly sales summary to a partner. The AI draft says that revenue increased by 20%, the working sheet shows $195 remaining after the three listed product costs, and the exported CSV includes a blank amount and a repeated invoice. These are three separate questions. The percentage may be arithmetically correct for the two reported periods, the $195 may correctly subtract the three example costs, and the file may still be unfit to distribute because it contains unresolved source issues. A green check on a formula is not a green check on the business report.
| Control | Current evidence | Decision |
|---|---|---|
| Input identity | INV-101 repeated; INV-102 amount blank | HOLD until ledger reconciles IDs and values |
| Amount types | One value is written as 80 USD | HOLD numeric aggregation until units and parsing are checked |
| Sales minus listed costs | $350 - $155 = $195 | PASS arithmetic only; not verified profit |
| Period-over-period change | ($420 - $350) / $350 = 20% | PASS arithmetic only; verify dates and like-for-like scope |
| External distribution | Two source exceptions unresolved | DO NOT SEND; resolve and approve a new version |
Give each exception an owner and a disposition. The invoice owner should verify whether the repeated ID represents a duplicate export or a legitimate multiple-line record. The bookkeeper or authorized finance reviewer should establish the missing amount, transaction status and currency before totals are used. The report owner should confirm whether the two periods cover the same business activity and whether returns, taxes and timing are treated consistently. The person who approves release should be able to trace every number to the source version rather than relying on a generated narrative.
When the issues are resolved, save a corrected copy and rerun the same checks. Compare the new row count and totals to the approved source, record any changes in a short exception log and attach the review date. If the source ledger cannot settle a disputed value, show it as unresolved or omit the unsupported metric with an explanation; do not invent a number to make the report look complete. This process is deliberately small enough for a freelancer or two-person shop, but the principle scales to larger workbooks.
For a safe starting point, test the fictional CSV above in the CSV Quality Checker, then use the Chart Axis and Denominator Checker to reason through the 20% growth example. Both are aids for human review, not accounting certifications or integrations with your business systems.
Explore related tools and guides in AI for Work & Business, including practical advice for freelancers, small businesses and office workers.