Reproducible Research Spreadsheets: Data Quality Workflow
A clean-looking spreadsheet can hide missing values, mismatched identifiers and overwritten source data. Use simple records and documented checks so someone else can follow the calculation.
Open the companion CSV quality checker
Before analyzing a small export, inspect its header, blank cells, repeated records, inconsistent field counts and mixed numeric-looking/text entries. The browser-only Research CSV Quality Checker accepts pasted CSV or a selected file and returns a counted report, without uploading or automatically changing records. It does not infer genuine participant identities or verify that the source values are true.
Start with the research question, then design the columns
A reproducible spreadsheet makes its units clear. Suppose a class is studying whether a voluntary practice worksheet is associated with later quiz scores. Before data entry, identify one row's meaning: one student, one quiz attempt, or one student-week? Those are different observations, even when they share column names. A sheet with multiple rows per student should never silently be treated as if every row belonged to a different independent person. Define the intended level of analysis, the time period and any exclusions before calculating averages.
Choose names that communicate content instead of labels like Value1, Info2 or Results. For a fictional exercise, columns might be participant_code, section, practice_minutes and quiz_score. The first is a local anonymized record identifier; section names a class group; practice_minutes is time measured in minutes; quiz_score is a numeric count with a documented permitted range. Do not enter names, contact details, school IDs or other personal information merely because a spreadsheet template has space for them. Institutions may require additional consent, restrictions or specific approved storage even for pseudonymized records.
Keep original records apart from transformations
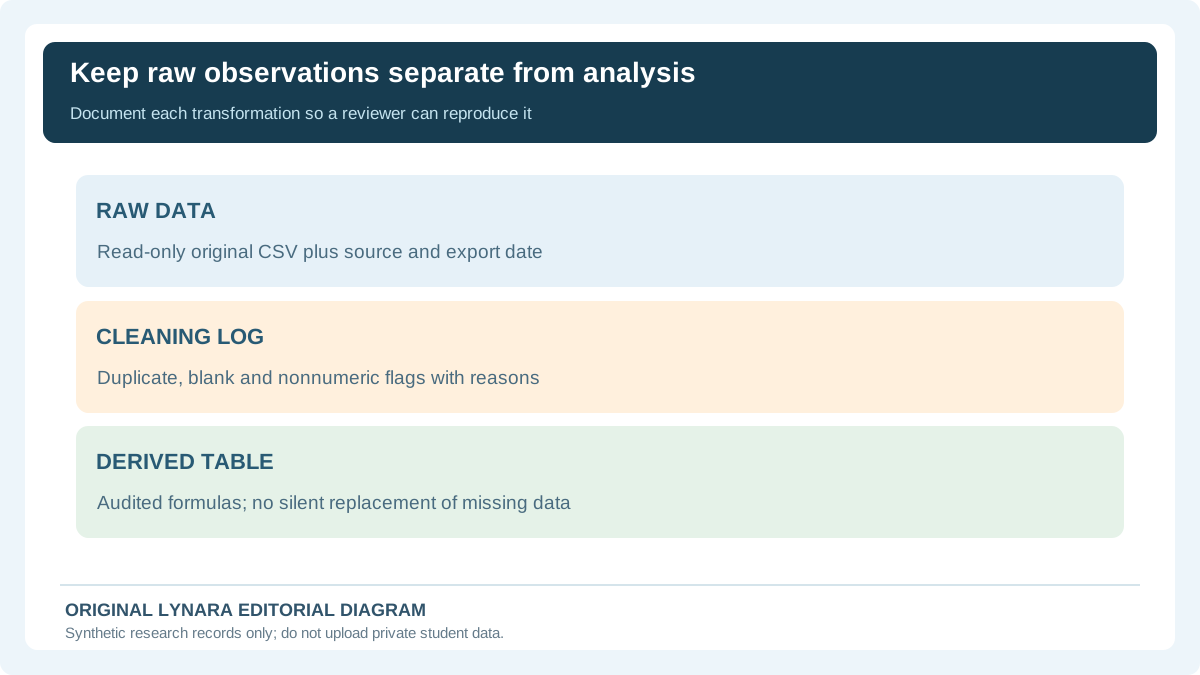
A robust beginner workbook can have a Read Me tab, an unchanged Raw Data tab, a Data Dictionary, a Quality Log and one or more derived-analysis tabs. These are roles, not a requirement to use exactly five worksheets. The Raw Data tab should preserve the imported values and ordering so you can trace every operation. If an entry is suspicious, record the question instead of silently overwriting the original. When corrections are verified against authorized source material, document who made the change, why, when and what the prior value was.
For a small example, imagine the raw minutes field contains 30, 45, blank and 60. It is tempting to replace the empty cell with zero because formulas are easier to calculate. But zero means the student reported no practice, while blank may mean the question was skipped, the form failed or the student was absent. These situations differ. Preserve the distinction. A derived column or separate analysis copy can encode an approved missing-value rule while keeping the original record visible. An unexplained replacement changes the observed data and may bias conclusions.
Write a practical data dictionary
For each variable, record the column name, human-readable meaning, type, unit, allowed values, missing-value convention, source and whether the field is an identifier, grouping variable, predictor or outcome. For example, section could allow only A and B; practice_minutes could be a nonnegative quantity measured in minutes; quiz_score could range from 0 to the total questions on that specific assessment. If the quiz includes different maximum scores across groups, do not combine raw point totals as though they were comparable without accounting for the assessment design.
The dictionary should also clarify whether a blank is permitted and whether entries such as NA, n/a, Missing or 999 are actual values or missing codes. Using several undocumented missing markers makes counting impossible to reproduce reliably. Where appropriate, document dates using an unambiguous format and define the collection timezone. A value formatted as 03/04/2026 is ambiguous without a declared convention. It may mean March 4 or April 3. Converting date strings without a documented rule can change the underlying chronology.
CSV is a useful export, not a complete research specification
Comma-separated values are useful because many tools can open them. A header line gives column names and data rows contain fields separated by commas. A quoted CSV field may contain a comma, a line break or a double quote escaped by a second double quote. That is why splitting every line at every comma is not a safe parser. The RFC 4180 CSV format memo describes common structural conventions, including a consistent number of fields per record and quote escaping.
CSV itself does not provide a full schema for the variable types, valid categories, unique keys or meaning of a missing cell. The W3C CSV on the Web primer explains why supplemental metadata are necessary for interpreting tabular data reliably. Keep the data dictionary alongside an export. If your spreadsheet uses formulas, remember that a plain CSV normally exports the current displayed values rather than preserving a complete, auditable spreadsheet formula system. Save the documented original workbook separately when reproducibility depends on formulas.
A worked six-record quality-control example
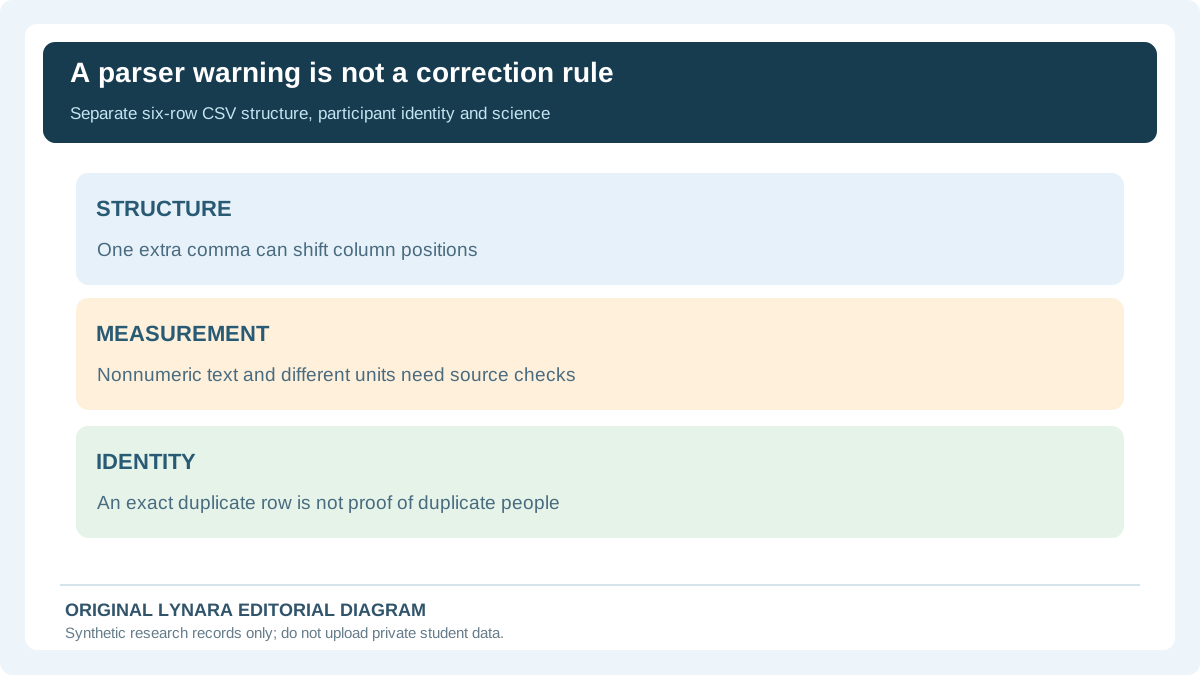
Imagine a fictional CSV with columns record_id, section, practice_minutes and quiz_score. Six data records are entered. Two rows happen to be byte-for-byte identical; one practice_minutes field is blank; one record stores the nonnumeric text forty instead of a number; and one row contains a stray extra comma that creates five fields instead of four. For this exercise, the quality report should not declare the repeated rows false or delete them. Instead it flags one exact repeated record, one missing practice_minutes value, a mixture of numeric-looking and text values in that column and one structural field-count mismatch.
If the six records include one row whose number of fields does not match the four-column header, you should resolve that structural inconsistency before trusting a mean of quiz_score. A parser might otherwise misalign the fields and interpret a section label as a score. The CSV checker explicitly reports these conditions, including the record numbers where some anomalies first appear. It does not claim to know whether forty represents a deliberate categorical code, an attempted numeric answer or a transcription error. Inspect the original data collection form or approved source before deciding what to change.
Calculate a missing-data summary instead of concealing the denominator
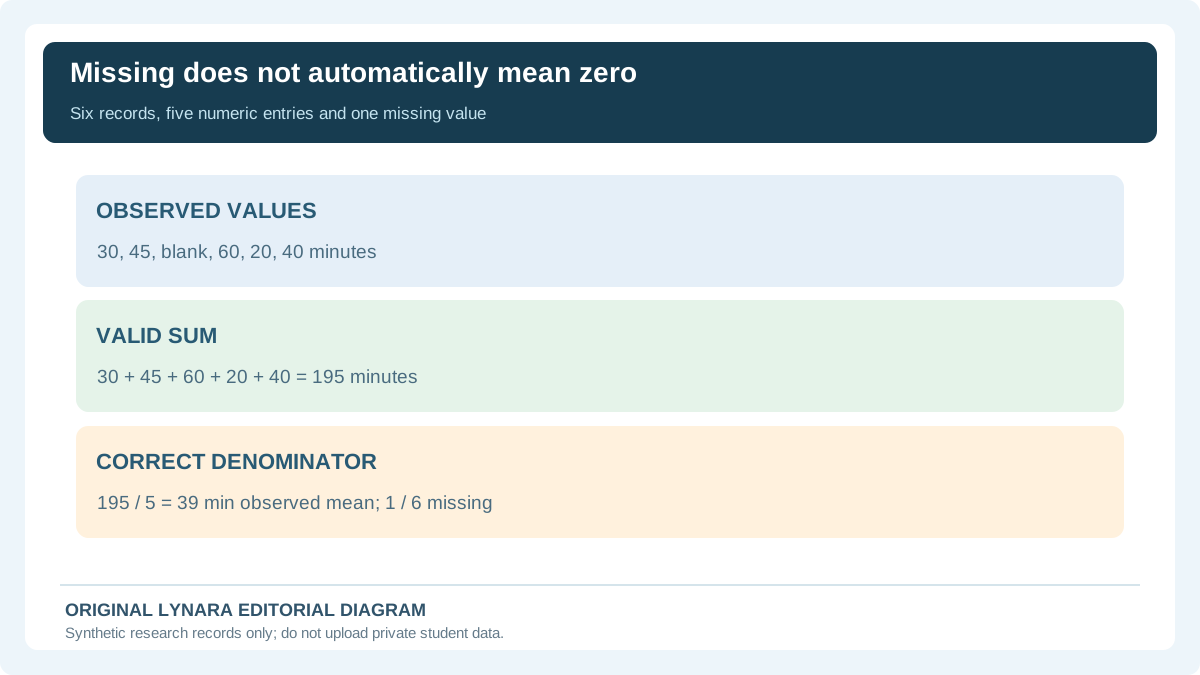
Suppose the six practice_minutes entries are 30, 45, blank, 60, 20 and 40, with one value genuinely missing. There are six records but only five observed numeric time values. The sum of known times is 30 + 45 + 60 + 20 + 40 = 195 minutes. The mean among the five observed entries is 195 ÷ 5 = 39 minutes. Dividing by six would instead produce 32.5 minutes and effectively treat the missing response as zero in the denominator. Neither result is a universal correction rule: the important point is to record which population and missing-value policy the statistic represents.
Reporting “mean practice time was 39 minutes among five observed respondents; one of six entries was missing” is more interpretable than presenting 39 alone. If missingness is related to attendance or motivation, complete-case analysis can still misrepresent the intended study population. A small classroom dataset usually cannot resolve that question from one spreadsheet check. Record uncertainty in the analysis notes. Do not ask an AI to choose a missing-value replacement merely to force every cell to become numeric.
Differentiate duplicate records from duplicate people
Two CSV rows with identical text may be a copy-and-paste mistake, or they might represent a legitimate repeated measurement at different times if the time field was omitted. Conversely, two separate rows with slightly different spellings may refer to the same participant while failing an exact-row comparison. This means duplicate rows and duplicate entities are not synonyms. The quality checker counts exact repeated rows and keeps the records; it never claims to resolve participant identity.
When repeated measurements are expected, define a compound key such as participant_code plus quiz_date or session_number, using only permitted data. Decide and document what makes an observation unique. A participant_code alone is not a valid unique row key when each participant can contribute multiple quiz attempts. If your research is sensitive or involves identifiable human subjects, do not share raw records publicly or with unauthorized AI services as part of cleaning. For disclosure and permission checks, review our student data privacy guide.
Check units, numeric conventions and impossible values separately
Suppose a column contains 0.5, 1.25, 45 and 90. There is no purely mathematical way for a parser to know whether the values are hours, minutes, scores or prices. A consistent numeric shape does not prove consistent measurement units. A classroom analyst should confirm the original instrument and write a documented transformation, such as multiplying explicitly labeled hours by 60 to produce minutes. A value like 1,200 may require CSV quoting because the comma otherwise acts as a delimiter. Decimal symbols and thousands separators can differ by locale, so avoid automatic corrections that reinterpret unknown text.
A sensible numeric validity rule may say practice_minutes must be at least zero, but the upper boundary depends on the research context. A 900-minute entry could be a recording mistake or a real multi-day study total; no generic tool can decide without the variable definition. The UK Government Data Quality Framework distinguishes validity and consistency from accuracy: even correctly formatted data may fail to reflect the real world. Treat automated checks as leads for source review, not proof of factual correctness.
Make spreadsheet formulas auditable
If a formula computes a percentage, describe both numerator and denominator in the analysis tab or Read Me. For example, 18 correct answers out of 24 possible yields 18 ÷ 24 × 100 = 75%. If quiz maximums vary, a normalized percentage may help comparison, but the research question may still require attention to differences in difficulty. Copying a spreadsheet formula down a column can also produce inconsistent references if absolute and relative cell addresses were not used intentionally. Inspect the first, middle and last computed results rather than trusting a filled column.
A transparent data pipeline might be: raw quiz_score → verify valid range and maximum for that assessment → calculate percentage in a derived column → document excluded or missing records → compute a summary only across the intended observations. Save a versioned copy of your rules and ensure another student with the authorized raw input could reproduce the results. If an AI writes formulas, compare the actual cells, references and calculated examples with the stated rule. Our AI evidence-checking guide explains the broader habit of independently verifying generated claims.
Keep a meaningful change log
A good quality log might contain the record key, variable, original value, problem observed, action taken, evidence source, person responsible and review date. If an entry is corrected after comparing it with the authorized original survey, preserve the prior value in the log. If the source cannot be checked, mark the issue unresolved rather than create a value that “looks reasonable.” Logging does not mean exposing student identities; use the institution's approved identifiers, privacy rules and access controls.
Change logs become especially useful when a team collaborates. Two analysts may independently edit separate workbook copies and unknowingly apply different missing-data rules. Name a reviewed version and store its dictionary and transformation steps with it. In a school project, this often prevents more confusion than adding another complicated formula. Do not claim the process is reproducible merely because a spreadsheet contains colored tabs; reproducibility means the data's origin, transformations and results can actually be traced under the permitted access conditions.
Use AI for critique, not for invented repairs
AI can help draft a data dictionary template, propose questions to ask about missingness or point out that a percentage needs a denominator. It can also misunderstand a locale-specific code, recommend deleting legitimate repeated measures or invent a substitution value without access to the source. A better prompt describes the abstract structure without pasting identifiable rows: “I have one row per assessment attempt. Column B contains a section code, column C a practice duration in minutes, and blanks mean no response. List quality checks I should verify myself. Do not alter values or assume independence.”
Then apply those checks to the authorized dataset yourself or with an approved local program. A generated explanation may be a useful starting point, but an AI cannot know whether a survey answer was honestly recorded unless you provide verifiable evidence, and it cannot grant permission to process school records. Lynara's checker needs no account or AI request, and it does not label a dataset approved for publication. That separation is intentional: the program screens syntax and counts; the student makes research decisions based on evidence.
Choose analysis only after confirming observation structure
Once column meanings and anomalies are documented, reconsider the study's statistical design. If each student is measured before and after an intervention, the two sets of scores are paired, not independent. If each row represents an unrelated student, an independent-group comparison may be more appropriate. A dataset with categorical section codes and numerical quiz scores may need a different method from one comparing two categorical outcomes. Cleaning the file cannot automatically determine the right test.
Our Statistical Test Decision Checker helps frame those design questions without claiming to test assumptions or compute a real study p-value. The companion statistical methods guide gives a deeper example of why AI can suggest the wrong analysis when observation pairing is unknown. This article addresses reproducible spreadsheet preparation, not statistical hypothesis testing or source citation formatting. For identifying a dataset's official author, date and version, use the distinct dataset citation guide.
Submission checklist for transparent class research
Before handing in your work, answer these questions: What does one row represent? Is there a data dictionary with units and allowed values? Is the raw export preserved? Did the team document missing cells, repeated records, inconsistent fields and unexplained data codes? Are formula examples calculated independently? Does the report state how many observations were included in each statistic and whether some were excluded? Could another authorized reader follow the transformations from raw values to the table in the final report?
For a practical first pass, open the local Research CSV Quality Checker and inspect the report without modifying the source. Then record what you verified and what remains uncertain in your data-quality log. A clean result is not proof the measurements are correct, participants are unique or statistical assumptions hold. It is one bounded, repeatable check in a larger research process.
Make the research file reviewable by another authorized student
Preserve three separate artifacts in the project folder: the original read-only export, the working table with transformations and a short decision log. The original should never be replaced silently, even when a cleanup seems obvious. Give each column a human-readable definition, unit, allowed values, missing-value notation, acquisition date and owner. A label such as practice_minutes is incomplete until the reader knows whether it measures one session, the whole day or a retrospective estimate. The W3C tabular data primer describes the value of metadata that makes tables interpretable beyond their physical CSV format.
| Problem to record | Example | Responsible resolution |
|---|---|---|
| Absent numeric value | One of six practice times is blank | Leave missing and report five-value denominator |
| Unexpected text | The word 'forty' in a numeric column | Check original collection form; do not guess |
| Extra CSV field | Unquoted comma splits a row into five fields | Review raw line and approved export format |
| Repeated record text | Two lines appear identical | Investigate observation key; do not delete by default |
For the separate six-response practice-time example, the known values 30, 45, 60, 20 and 40 sum to 195. Their observed mean is 195/5 = 39 minutes, with one of six records missing. Using six in the denominator would compute 32.5 and implicitly introduce zero time for the absent respondent. But inserting 39 into the missing cell is also an assumption, not an authenticated observation. Retain the observed statistic, missing-count summary and any limitations on the sample.
A formula can be correct yet applied to the wrong observations. Identify what qualifies as a row, whether repeated rows correspond to repeated sessions or copied records, and whether an ID is unique at the student or assessment level. The UK's Government Data Quality Framework separates dimensions such as completeness and consistency; neither a green CSV checker result nor a regenerated AI table proves that underlying measurements are true. Save a screenshot-free, selectable-text transformation log so future reviewers can reproduce the analysis without a proprietary interactive session.
Start with Lynara's Research CSV Quality Checker to identify structural issues, then verify each proposed fix against the original authorized records. Do not copy personal student data into a third-party AI tool without appropriate permission, and do not publish participant IDs in a convenience download. The report should distinguish what was detected mechanically, what was investigated, what was corrected and what remains unresolved.
A small provenance ledger for a reproducible CSV handoff
When a project changes hands, filenames such as final-data-v3.csv do not prove which bytes were analyzed. Keep the original file read-only in approved storage, calculate a SHA-256 checksum using an institution-approved local tool, and record that checksum alongside the file's creation/export date, schema version and authorized custodian. A checksum detects accidental changes to the same file; it does not anonymize participant data, establish that the observations are true or replace secure storage.
| Stage | File and record | Reproducibility check |
|---|---|---|
| Raw export | raw-survey.csv · date, schema and locally computed SHA-256 | Preserve unchanged; record who can access it. |
| Validated working copy | survey-clean-v1.csv · new checksum | Record exactly which rows and columns changed and why. |
| Analysis output | summary-v1.csv · formula/script version | Recompute five observed times: 195 ÷ 5 = 39 minutes; flag one missing record. |
Never publish the raw dataset or its download link merely to demonstrate reproducibility. The existing CSV Quality Checker can help spot structural issues, but it does not compute a trusted provenance chain or establish permission to share personal information. Follow the institution's data retention and privacy policy.