How to Choose a Statistical Test for Student Research
A plausible AI-generated test name is not proof that a method matches your data. Translate the question into a defensible study design before using a calculator.
Start with the decision checker
Choose between independent groups, paired scores, categorical association, numerical relationships and repeated measures. The tool returns a conditional method family and the checks that remain, not a test result.
Open the Statistical Test Decision Checker → · Browse the actual statistics calculators
Why an AI-suggested test can be the wrong starting point
Imagine asking a chatbot, “Which statistical test should I use to compare scores?” It might answer “independent t-test” immediately, even though it has not been told whether the scores came from different students, the same students before and after instruction, or repeated assignments from the same class. The name sounds authoritative; the study design is missing. You need to know what was measured, what was compared, who supplied each observation, and how the observations relate before choosing a method.
This is an excellent division of labor between a student and an AI assistant. Ask AI to list plausible analysis families and the questions it would need answered, but verify those questions against the actual dataset, instructions and a statistics reference yourself. Do not ask an AI to fill unknown details with assumptions and then quote its choice as a validated method. Our AI claim verification workflow helps with reference claims; this guide deals specifically with the logic of statistical design, not a general fact-checking score.
Classify the outcome before worrying about software buttons
A numeric measurement such as test score, hours studied or reaction time is different from a category such as completed/not completed or chosen method A/B. The variable's role also matters. Comparing average quiz scores across classes is a group comparison; asking whether longer study hours go with higher scores is an association question between numeric variables; asking whether two categorical labels tend to appear together is another kind of association. You cannot pick a reliable statistical test using only the dataset's column names without deciding what scientific or classroom question you are answering.
Write one sentence describing your intended inference: “I want to compare average scores between two independent classes,” or “I want to compare each student's score before and after a practice session.” Label your outcome and comparison variable separately. If you cannot do this clearly, the safest next step is to clarify the research question, not to generate p-values. If you have not yet decided whether the project calls for interviews, observations or measurements, review our qualitative-versus-quantitative research guide first; that design decision comes before selecting a statistical test. If a project involves one classroom conveniently sampled, make that limitation explicit even when the arithmetic is correct.
Independent groups versus paired observations: a fundamental distinction
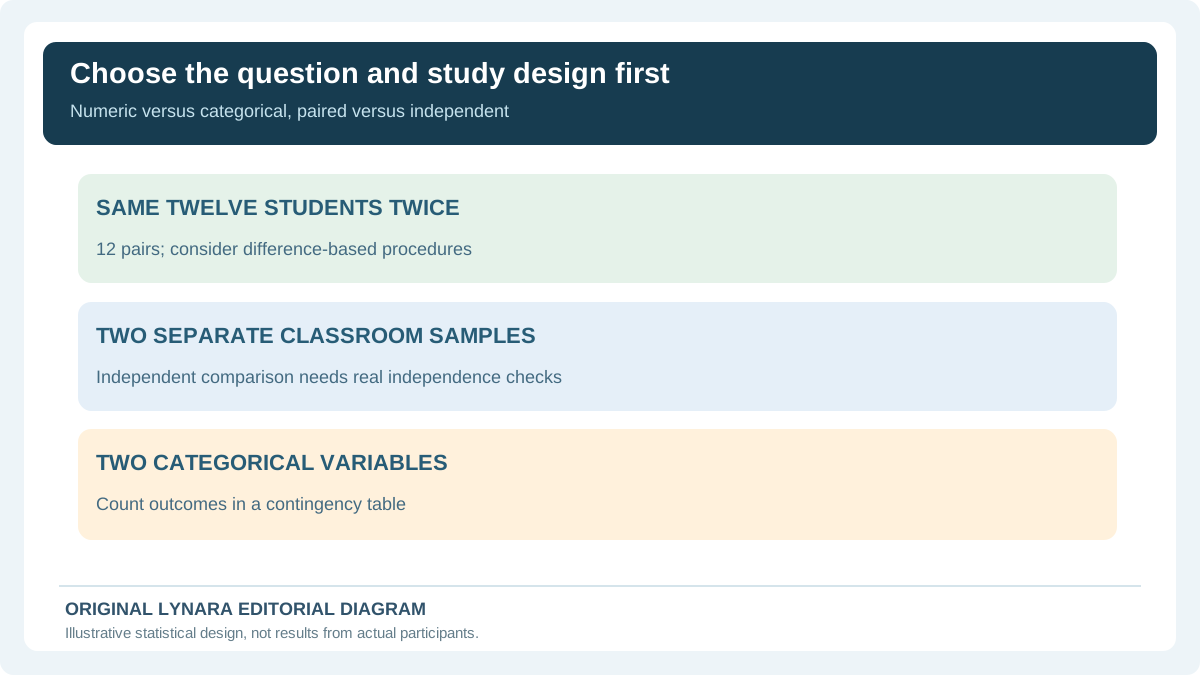
Suppose 12 students each take a short test before a lesson and again afterward. You have 24 recorded scores but only 12 students. Every student's second score is intentionally matched with that student's first score. The natural starting quantity is the within-person difference. A paired-sample t-test may be a candidate if the difference scores and the other assumptions warrant it; an independent-groups t-test would ignore the matching. A separate study comparing two unrelated sets of 12 students instead has independent groups, assuming the students were not measured multiple times or otherwise clustered in a way the method ignores.
The choice is not determined by whether both studies have two columns in a spreadsheet. It is determined by how the records were produced. Ask whether each row belongs to a unique person, whether the same participant appears in two conditions, and whether the observations share a class, household or other relevant cluster. For three or more measurements per person, the decision is more complex still: repeated-measures or mixed-effects approaches may be relevant, and a standard independent-group ANOVA is not automatically appropriate.
Comparing numeric outcomes across two or more groups
If two independent groups have a numeric outcome and your goal is to compare their means, a Welch two-sample t-test can be a reasonable candidate to investigate because it does not demand equal population variances. That does not make it immune to poor sampling, strong outliers, repeated measurement, nonnormal behavior at small sample sizes or an inappropriate causal interpretation. Before using it, consider the data distributions and whether the design creates genuine independent observations. Do not claim that pressing a “Welch” option makes the design valid.
For three or more independent groups with numeric outcomes, a one-way ANOVA family is another possible route. A conventional ANOVA and Welch ANOVA address different variance conditions. An overall significant result, if eventually obtained from a valid analysis, does not by itself identify which specific pair of groups differs; any follow-up comparisons require a planned method and attention to multiple testing. The NIST Engineering Statistics Handbook discusses the one-way ANOVA model and its independence, normal-error and variance assumptions. It is a reference for the logic, not a substitute for examining your actual study.
Categorical questions need counts, not averages of arbitrary labels
Suppose a classroom project records whether a task was completed and which of two teaching formats a student used. Both variables are categorical. You can build a two-way contingency table of observed counts and ask whether the categorical variables are associated. A chi-square test of independence may be considered when observations are independent, the category definitions are appropriate and expected counts support the approximation. This is a different question from testing whether the mean of two numeric score distributions differs.
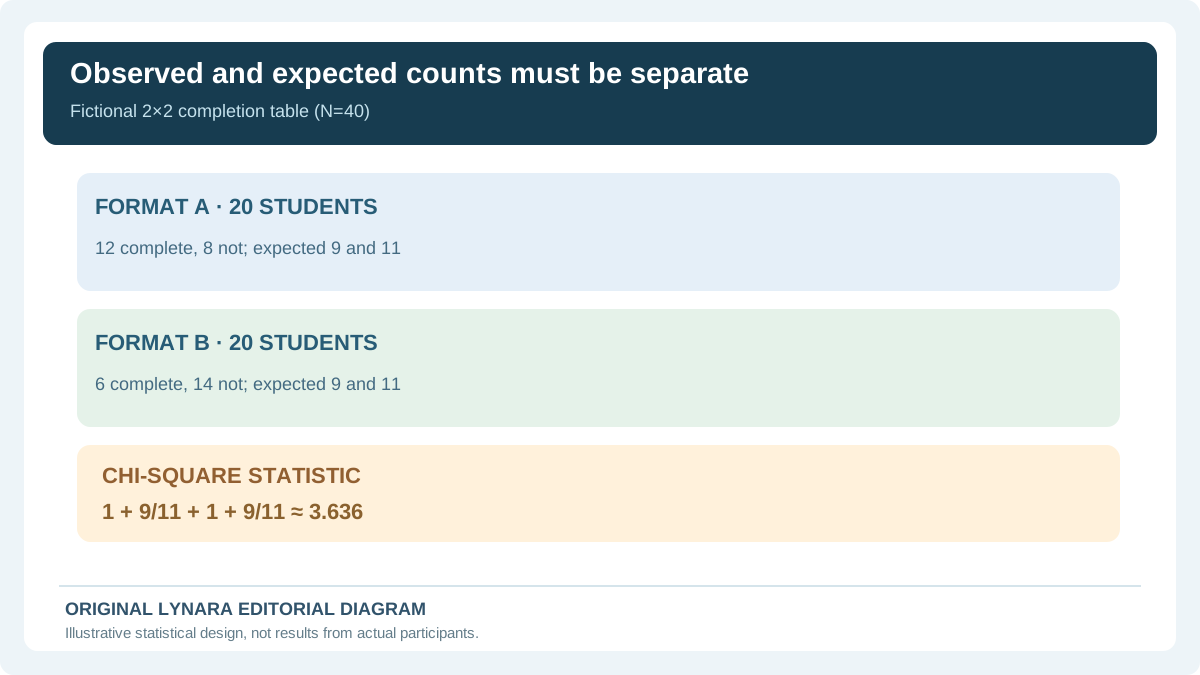
For a fictional example, imagine 20 students in format A and 20 in format B. In format A, 12 complete the task and 8 do not; in format B, 6 complete the task and 14 do not. Across all 40 students there are 18 completions and 22 non-completions. Under independence, the expected number of completions for format A is 20 × 18 ÷ 40 = 9; the expected number of non-completions is 20 × 22 ÷ 40 = 11. The same expected values apply to format B because both row totals are 20. These expected counts are not predictions about individual people and do not prove a real intervention worked.
Check the contingency-table calculation without inventing a result
The familiar chi-square statistic for a simple contingency table adds (observed − expected)² ÷ expected across its cells. Using the fictional counts above produces 9 ÷ 9 + 9 ÷ 11 + 9 ÷ 9 + 9 ÷ 11 = 1 + 0.81818… + 1 + 0.81818… = approximately 3.636. This is only the test-statistic calculation for a hypothetical example. We have not reported a study p-value, checked how students were assigned, demonstrated independence, or tested a real research hypothesis. A classroom analyst should also understand degrees of freedom and the interpretation requirements before calculating or writing a conclusion.
The Penn State STAT ONLINE chi-square review gives the independence setup, expected-count formula and statistic. If your table has sparse expected counts, do not assume a large-sample chi-square approximation is suitable. A 2×2 table may lead to consideration of Fisher's exact test, but even that route needs a justified design and professional or instructor guidance. The checker deliberately stops on small or unreviewed expected counts.
Two numeric variables: inspect the relationship visually
When your question asks whether study hours and exam scores vary together, the first useful step is a scatterplot of the paired observations. Look for a roughly straight-line pattern, a curved trend, exceptional points, a floor or ceiling on one of the scales, and whether the same student generated several points. Pearson correlation describes linear association under relevant conditions. Simple linear regression concerns a response and predictor with model assumptions. They are related but not identical questions, and neither method can turn an observational study into evidence of causation by itself.
For a pattern that is monotonic but not reasonably linear, an analyst might discuss rank-based correlation such as Spearman rather than automatically report Pearson. For strongly curved patterns, clustering or influential observations, more careful modeling may be required. The NIST residual-diagnostics discussion explains why examining unexplained structure matters in model-based analysis. The correct practice is to inspect the plotted measurements and context before choosing the numerical statistic.
Make assumption checks visible in your assignment
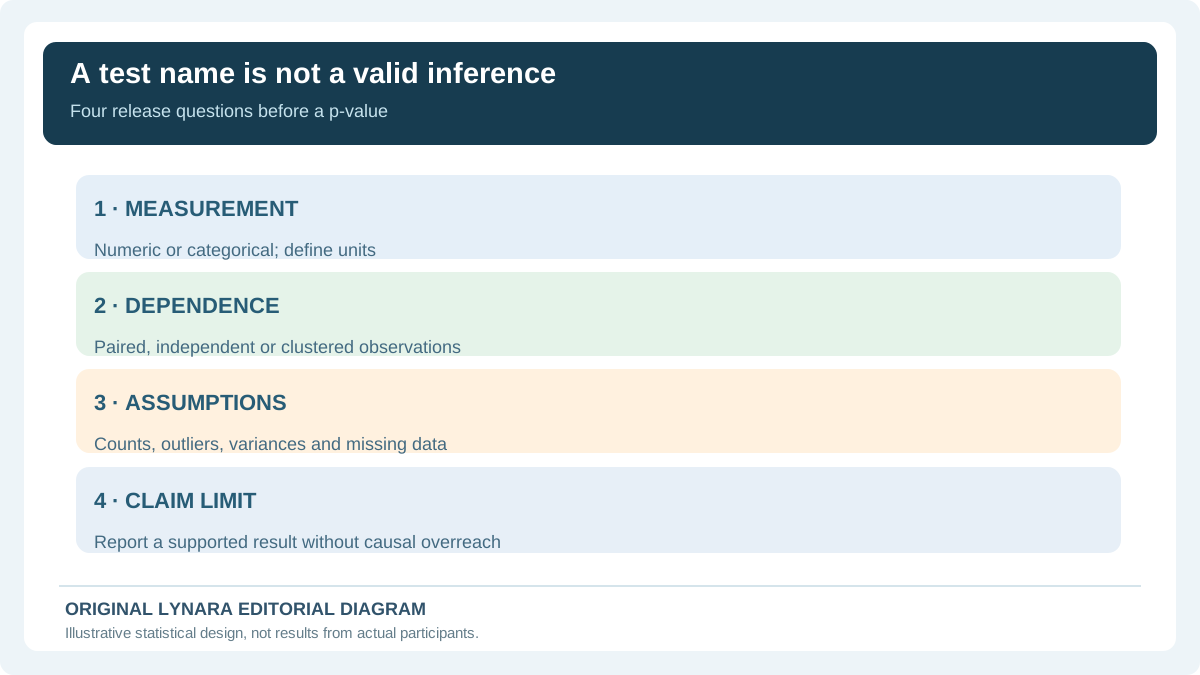
A polished methods paragraph should state the design, outcome type, study units, method candidate and reasons the method was selected. It should also describe any important assumptions that were actually checked and unresolved limitations. For paired data, report how the pairs were identified and whether any participants lacked one measurement. For independent groups, say what makes the groups independent. For categorical tables, explain the categories and what you checked about expected counts. For regression or correlation, mention the scatterplot and relevant residual diagnostics where applicable.
A statement such as “the AI said this was the correct test” is not a method justification. Nor is “assumptions passed” when no diagnostics were performed. If instructions require a named method, follow the instructor's expectations or explain why a different method might be appropriate before changing the analysis. Small course projects can be valuable as learning exercises even when their convenience samples do not support broad conclusions about all students or schools.
Use AI to challenge your reasoning rather than rubber-stamp it
One useful prompt is: “My outcome is a numeric quiz score. Twelve students completed a pre-test and post-test, and each row records the same student twice. List the questions I should answer before choosing a statistical method. Do not invent assumption checks or report a p-value.” This makes the input design explicit and asks for a checklist rather than a false confirmation. An AI might identify pairing, missing data, the distribution of score differences and interpretation limits. Verify the response against course notes and a primary statistics reference.
A less useful prompt would be “Analyze my project and tell me which test is significant” before checking the data, measurement units or assignment rules. That request encourages an answer without a defensible basis. Do not paste classmates' identifiable records, unpublished research or protected education files into services without authorization. Lynara's student data privacy guide outlines a separate permission and redaction decision. Our decision checker needs only category selections and runs inside your browser; it does not require your raw dataset.
From candidate test to actual calculation
When the study question and assumptions have been reviewed, go to an appropriate calculation tool and inspect its specific input definitions. A t-test calculator needs more than a test name: it may require group summary statistics, sample counts, a specific independent or paired design, and a clear alternative hypothesis. A chi-square calculator requires a genuine frequency table. A correlation calculator needs paired numeric observations. Always compare the tool's assumptions and formula with what your course expects before transferring numbers.
Use the Statistical Test Decision Checker to preserve your preliminary design reasoning, and the Statistics Calculators hub only when you are ready for arithmetic. Keep a record of diagnostics and limitations in the final assignment. The checker cannot certify independence, distribution shape, data quality, ethical permission, or statistical significance. A valid explanation remains the student's responsibility—even when an AI produced an impressive-looking test recommendation.
Practical checklist before submitting
Ask yourself: Is the outcome numeric or categorical? Is my question comparison or association? Are observations independent, paired or repeatedly measured? Have I inspected distributions, counts and unusual values? Can I identify a primary source for the method? Have I calculated or checked each intermediate value rather than copied an AI summary? Does my interpretation match the study design and avoid unsupported causal claims? If any answer is unknown, write it down as a next step rather than quietly claiming completion.
This guide is educational, not a full statistics curriculum. Complex samples, clustered classrooms, missing-data mechanisms, nonstandard outcomes and causal designs require more than a six-option chooser. Method selection should come from a defensible combination of the research question, the actual data and the relevant statistical assumptions.
A compact decision table for three real assignment designs
Students can make analysis more reliable by describing their research question without using test names initially. Suppose you are comparing the same twelve students' scores before and after a tutorial; the unit of analysis is the student, and the two measurements are paired. An independent-group t-test would treat the twenty-four scores as though they came from twenty-four unrelated people. If the project instead compares two classes with different students, genuine independence may be relevant, but classroom clustering or prior differences can still complicate a naive comparison. Finally, if the outcome is completed/not completed and the predictor is teaching format A/B, the data are categorical counts and need a different family of analysis.
| Question and unit | Possible method family | Unverified conditions to inspect |
|---|---|---|
| Same students before/after, numeric differences | Paired t procedure for suitable differences | Pair IDs, missing follow-up, distribution of differences |
| Two unrelated groups, numeric score | Welch independent-sample t test as a candidate | True independence, data shape, outliers, sample design |
| Two categories versus two categories | Chi-square independence or an appropriate exact method | Genuine counts, independent units, adequate expected frequencies |
| Study hours versus score, both numeric | Correlation or regression family, as justified | Scatterplot, curvature, outliers, repeated observations, causal limits |
The fictional completion counts in the guide have a total of forty students. In format A, twelve finish and eight do not; in B, six finish and fourteen do not. Expected counts under a null hypothesis of independent categories are 20×18/40 = 9 completed and 20×22/40 = 11 not completed in each row. The four contributions to the Pearson chi-square statistic are 9/9, 9/11, 9/9 and 9/11, totaling approximately 3.636. The Penn State STAT ONLINE review sets out the expected-count formula and sum of observed-versus-expected terms. This calculation is not a real classroom p-value and should not be presented as such.
For ANOVA, the NIST Engineering Statistics Handbook explains normal, independent errors and variance assumptions for its standard one-way model. An instructor may suggest a Welch or robust approach where assumptions differ. Do not simply make up a statement that the assumptions were satisfied; check them against actual observations. If the project has clustered classmates, repeated measures, small expected cell counts or incomplete data, stop at a conditional recommendation and consult a qualified instructor or statistician before writing an inferential conclusion.
Finally, report what the test can and cannot establish. Observing an association between a teaching format and completion in a convenience sample does not prove that the format caused the difference. The Statistical Test Decision Checker organizes the evidence required, and Lynara's statistics calculators can check arithmetic for supported data. Neither tool knows whether you obtained consent, sampled appropriately or met all statistical assumptions.