Qualitative vs. Quantitative Research: School Project Examples
Choose an evidence-gathering method that matches the research question and the actual limits of a class project.
The question should determine the method
A student might want to know whether classmates enjoy online lessons, how they describe interruptions during homework or whether a different timetable is associated with test scores. These questions do not ask for the same kind of evidence. Qualitative research often explores meanings, experiences and processes in depth, while quantitative research uses measurements or counts to examine specified patterns. The distinction is not a claim that one type is inherently more scientific, objective or difficult. Each can be done carefully or badly. Before collecting anything, state exactly what your project should answer. A question beginning how do students describe is different from what percentage of surveyed students reports. A classroom project that promises to prove a cause usually demands stronger design than a convenient survey can provide. Purdue OWL's introduction to primary research identifies interviews, surveys and observations as distinct approaches. Use the intended evidence, time, access and ethics requirements to choose among them.
What a qualitative interview can reveal
A semi-structured interview may ask students to describe what distracts them while studying, what they have tried to change and why certain interruptions feel difficult. The researcher can ask follow-up questions that were not obvious when the initial question list was written. The output is usually a set of rich responses, not a percentage that automatically represents the whole school. The goal may be to identify recurring themes, unexpected problems or differing experiences. A good interview plan uses a focused question guide and avoids leading respondents toward an answer. Instead of asking why is this bad learning app distracting, ask when does the app help and when does it create interruptions. Obtain the relevant permissions and avoid collecting sensitive private information without authorization. Six willing classmates can provide illustrative perspectives, but their comments cannot be reported as the measured opinion of every student in a district. The project's conclusion should match that limited evidence. Purdue's primary-data analysis guide discusses grouping interview responses into meaningful categories.
What a quantitative survey can show
A survey can ask a defined group the same questions and count responses. If forty students complete an optional questionnaire and twenty-four select a particular option, then sixty percent of the respondents selected it. That is an accurate arithmetic description of those forty responses, not automatically a valid estimate for all students in the school. The population, recruitment method, nonresponse and question wording determine whether a wider inference is defensible. More decimal places do not repair biased sampling. Surveys work best when respondents interpret the question consistently. An item asking do you frequently study with AI may be ambiguous because one student interprets frequently as daily and another as weekly. A question defining at least three days during the last seven days is easier to count, although it may not capture the full experience. Purdue OWL's survey-design guidance recommends identifying the target group and method in advance. Those decisions matter more than the speed with which an AI tool can produce an attractive online form.
Compare two versions of the same research question
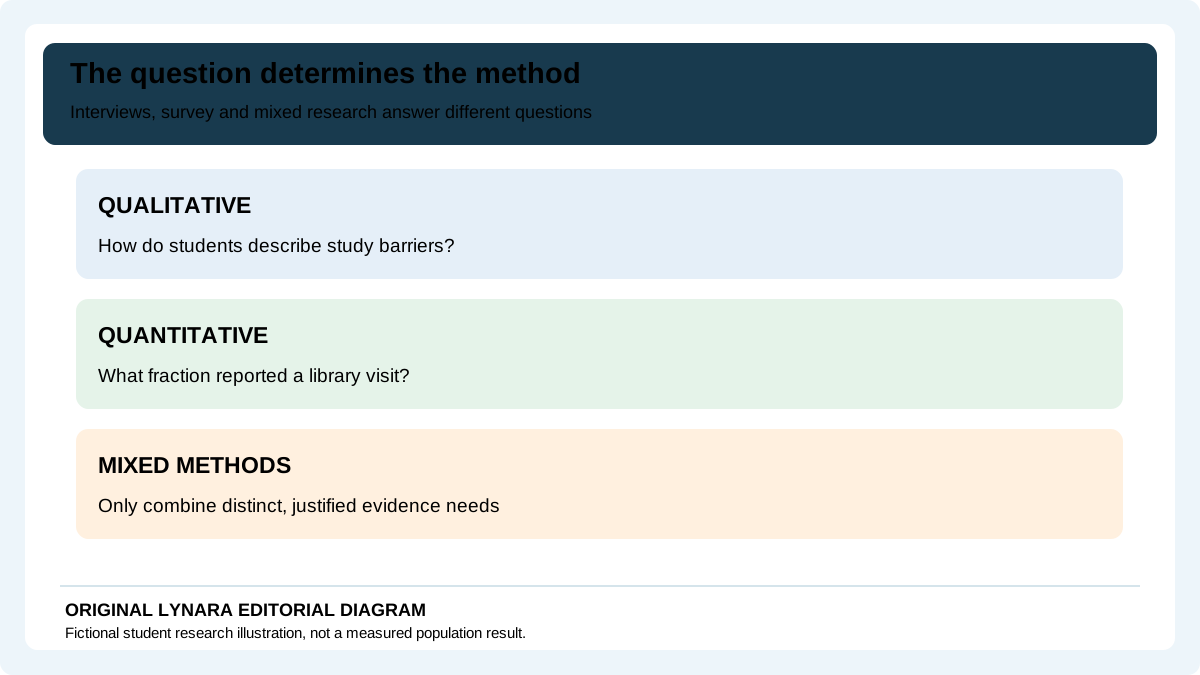
Suppose the topic is school library use. A qualitative question could be: What obstacles do students describe when trying to study in the library after class? The student could conduct a small number of permitted interviews and analyze recurring descriptions of opening hours, noise, access and study needs. A quantitative version might ask: Among respondents to a defined class survey, how many visited the library at least once last week? That gives a count and proportion for the surveyed group. Neither question automatically explains the other. A mixed approach might use an anonymous questionnaire to identify a pattern, followed by a small set of optional interviews to explore possible reasons. But combining methods does not fix invalid sampling or consent problems. Mixed methods increase work, create separate data-management obligations and require a clear explanation of how the findings fit together. The two designs should be judged by what they can actually support, not by whether a mixed-methods title sounds more sophisticated. This is the key point students should understand before drafting a methodology section.
Sampling is a practical and ethical design decision
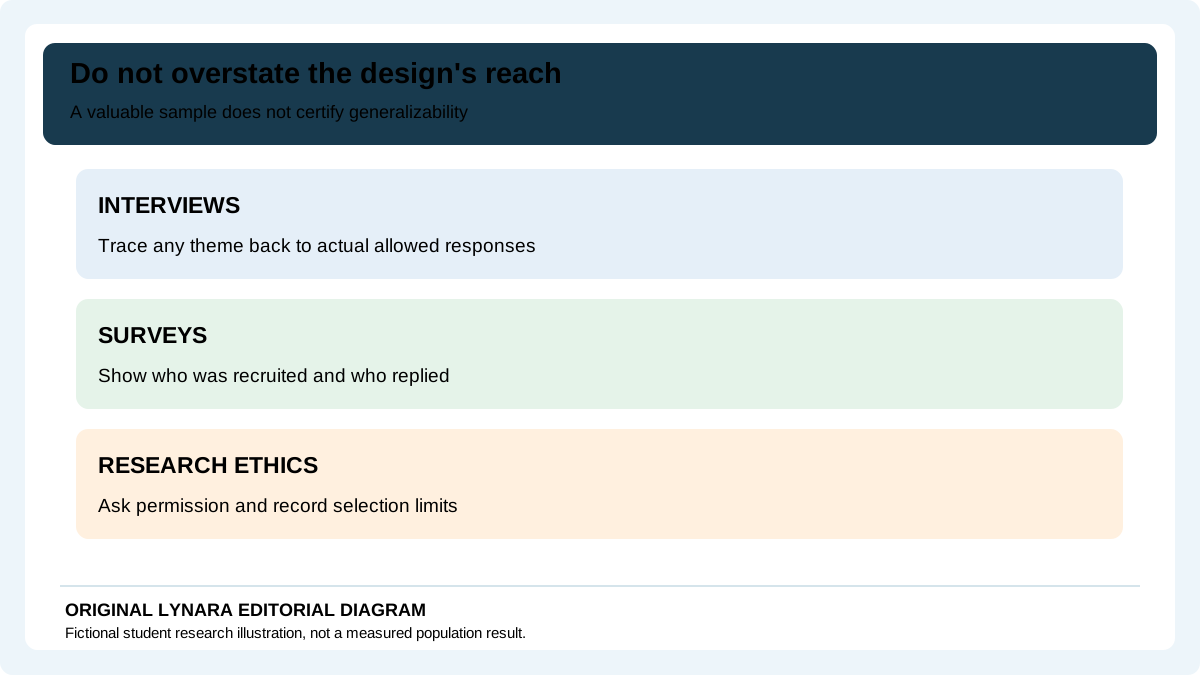
Imagine a class of twenty-five students in which twelve volunteer for interviews. Those volunteers may differ from students who choose not to participate. Perhaps they are more engaged or less concerned about speaking publicly. Even if their stories are valuable, the sample does not guarantee representative coverage of the class. A school-wide survey with responses mostly from one grade has another limitation. State how participants were recruited, how many were invited, how many responded and what the method can reasonably generalize to. Do not collect names, health conditions, private grades or other identifiable information merely because a form makes those fields easy to add. School policy and parental permissions may apply, particularly when research involves minors. The student privacy checklist explains why identifying details should not be uploaded to outside AI services without appropriate approval. A good research question can often be answered using anonymized, nonsensitive observations or published public datasets, avoiding unnecessary collection of classmates' information.
A worked quantitative example with a clear denominator
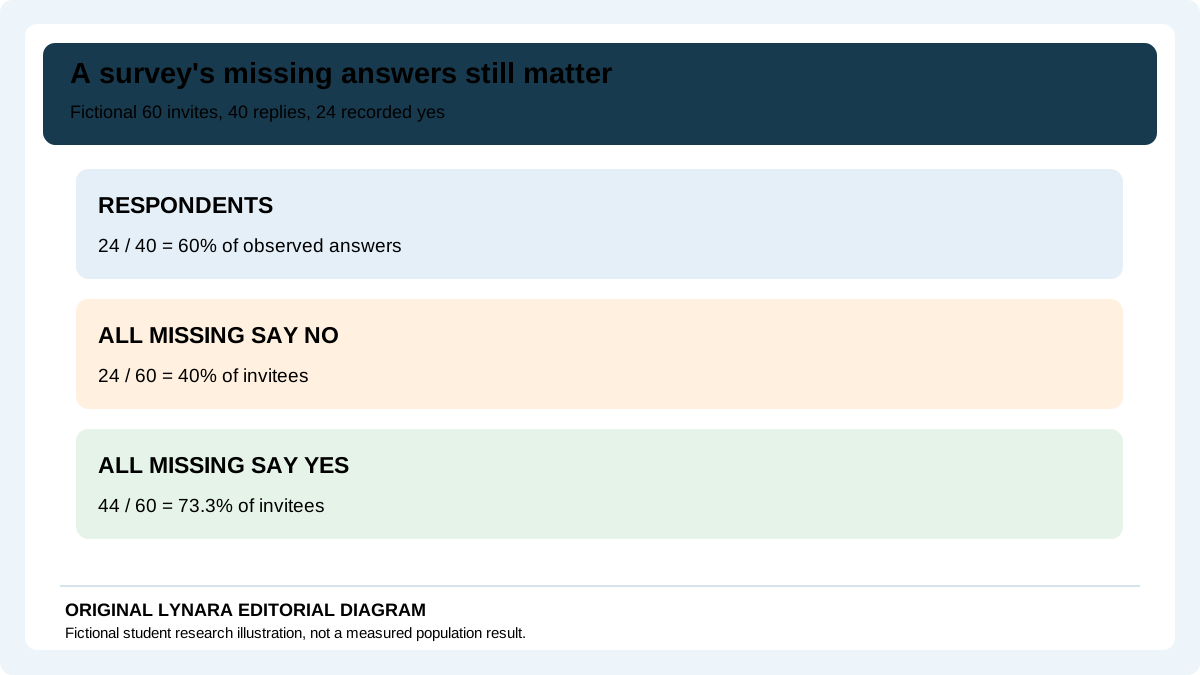
Suppose a hypothetical questionnaire is offered to sixty eligible volunteers and forty respond. Of those forty respondents, twenty-four report using the school library during the previous week. The observed proportion among respondents is 24 ÷ 40 = 0.60, or sixty percent. The response rate to the invitation is 40 ÷ 60 = about 66.7 percent. Those are two different percentages with different denominators. If a report simply says sixty percent of students use the library, it hides the sampling limits and the time frame. The defensible statement is narrower: twenty-four of forty voluntary respondents reported using the library in the specified week. Nonrespondents may have had different habits, and the sample is not necessarily random. A margin-of-error calculator cannot remove those design problems. Our statistics calculators can support arithmetic and selected sampling models once their assumptions are justified, but the student must describe what the figures represent. This worked scenario is invented for instruction, not a real school survey.
Analyzing interviews is not just selecting favorite quotations
Qualitative analysis requires a transparent way to read and compare responses. A student can begin with an anonymized transcript or permitted notes, identify relevant statements and assign short descriptive codes such as limited hours, noisy seating or difficulty finding a desk. Similar codes can be grouped into broader themes. The researcher should then look for answers that contradict a favored interpretation, not only the most memorable quote. The purpose is to explain how a theme was identified, with enough context that readers can judge the reasoning. If four interviewees mention noise and two do not, that count may be worth noting, but it does not turn a small interview sample into a representative percentage. A quotation is evidence of what one person said, not necessarily of what everyone experiences. If AI assists with coding, check the suggested themes against actual allowed source material and preserve participant privacy. Do not present model-generated quotes as genuine interviews. The researcher remains responsible for the authenticity and interpretation of observations.
Use different visual summaries for different findings
Quantitative results may fit a carefully labeled frequency table or chart. If the class survey asked one yes-or-no question of forty respondents, a table showing twenty-four yes and sixteen no is transparent. A bar chart should show the categories, counts or percentages and clear denominator. Do not use a decorative three-dimensional graph that makes a modest difference look enormous. Check that every plotted number can be reproduced from the dataset, and distinguish missing responses from explicit no answers. Qualitative findings may fit a theme table with short descriptions and anonymized supporting excerpts where permitted. A theme diagram is sometimes useful, but counting code mentions alone does not prove importance or prevalence. Each visual must match the kind of data collected. The academic evidence evaluation guide explains the boundary between what a source reports and what a writer can responsibly claim. A polished AI-generated chart cannot correct missing data or an unsuitable study design.
Writing limitations that are honest and useful
Every student report should explain who or what was studied, how observations were obtained, the analysis performed and the resulting limits. A small convenience sample can be appropriate for a classroom learning exercise when the project is described as exploratory. It becomes misleading when the conclusion claims to speak for an entire city or establish the cause of a change. Similarly, a percentage from a voluntary online form may be accurately calculated while being unsuitable for generalization to a larger population. Do not pad the methods section with technical terms that were not actually implemented. If there was no randomized assignment, do not describe the project as a randomized experiment. If interview responses were summarized by hand, do not claim a sophisticated automated analysis was validated. Explain what was actually done, including approvals, recruitment and how disagreements were handled. An honest, modest conclusion supported by a transparent method is more credible than an ambitious conclusion whose evidence cannot be checked.
A method-selection checklist for a school assignment
Write one clear research question, identify the desired form of evidence and determine whether permission is required before collecting data. Choose interviews when an in-depth account of experience is needed and a suitable small sample can be reached. Choose surveys or other quantitative measures when the research question calls for counts or measured associations under a defensible sampling plan. Consider a mixed design only when each part has a clear job and the workload is feasible. Before using AI to draft a plan, specify the permitted sources and ask the assistant to critique questions for ambiguity rather than fabricate results. Keep actual responses, measurements and analysis under the student's control. Use the Statistical Test Decision Checker to review whether a proposed quantitative analysis fits the study design, and Lynara's statistics tools to check valid numerical summaries and our privacy guide to reduce unnecessary disclosure. The output should be a project you can honestly describe from start to finish, not one that uses impressive-sounding method labels to conceal gaps.
Make a practical choice and document its limits
For a fictional library-use assignment, a student can ask either how classmates describe difficulty finding a quiet place or how many surveyed students used the library during a particular week. Interviews produce contextual accounts and themes; a specified questionnaire produces counts and sample proportions. Neither is a randomized experiment. To avoid misleading results, identify the unit of observation, eligibility, response count, missing entries, consent rules and exact questions before data collection.
| Method | Possible output | Unjustified conclusion |
|---|---|---|
| Six interviews | Reasons described by six consented participants | Every student faces the same barriers |
| Voluntary survey | 24 of 40 respondents reported a visit | 60% of all invited or enrolled students visited |
| Both | Specific themes considered alongside a bounded sample rate | The design proves what causes library use |
If sixty students receive invitations and only forty answer, the 24 positive answers represent 60% of respondents. The twenty missing answers could change any claim about all invitees: 24/60=40% if all would say no, versus 44/60≈73.3% if all would say yes. This sensitivity range does not estimate the school population or correct self-selection. Purdue OWL's primary data guidance cautions that small samples should not be overgeneralized. Preserve genuine quotes and avoid uploading private student responses to unapproved services.
Source and editorial notes
All class research scenarios are invented learning exercises. The cited Purdue University material supports general method distinctions, not claims about any actual student population. Follow school ethics, permissions and privacy rules.
What the twenty missing survey responses could change
In the invented library-use example above, 24 of 40 respondents answered yes, while 20 of the 60 invited students did not respond. Without assuming anything about those missing answers, two extreme arithmetic scenarios show why 60% of respondents must not be reported as 60% of everyone invited. If all 20 nonrespondents would have answered no, the yes count among invitees would be 24 ÷ 60 = 40%. If all 20 would have answered yes, it would be (24 + 20) ÷ 60 = 73.3%.
| Assumption about 20 nonrespondents | Yes responses among 60 invitees | Percentage |
|---|---|---|
| All would say no | 24 of 60 | 40% |
| All would say yes | 44 of 60 | 73.3% |
| Observed respondents only | 24 of 40 | 60% |
The extremes are illustrative bounds for this specific invited group, not a statistical confidence interval, population estimate or claim about how nonrespondents actually behave. Survey design, recruitment and selection bias remain separate limitations. Use the Statistical Test Decision Checker only after deciding whether a formal inference is justified.