How to Make an Accessible Visual Study Guide
A study sheet that looks lovely but can't help you answer a question is decoration. Here's how to make one you can actually test yourself with.
A visual study guide must help you remember, not just look polished
Colorful revision posters, flashcards, timelines and mind maps may seem more engaging than ordinary notes, but an attractive page is not proof that learning occurred. Start with the question students should be able to answer after using the visual. If the goal is to distinguish causes from effects, a cause-and-effect diagram may help. If the goal is to remember a chronological sequence, a timeline may be clearer. If the goal is to retrieve definitions, a flashcard or practice quiz may be better. Choose the format based on the learning task, not because an AI image looks impressive.
Turn a learning objective into a picture
Suppose a fictional biology assignment requires comparing mitosis and meiosis. A useful visual could align the number of divisions, resulting cells and genetic outcomes in labeled rows. The headings should make the comparison easy to follow, and important exceptions should be stated in accompanying text. A decorative cell image without labels is less useful for the specific objective. Before drawing, write three or four questions your guide must answer. After using it, hide the guide and test whether you can answer those questions from memory.
A hierarchy makes information easier to scan
A heading should tell the reader what the page is about; subheadings should divide the task into logical parts. Visuals often fail because every word uses the same font weight, every box is brightly colored and every annotation competes for attention. Use a clear reading order, brief titles and sufficient spacing. For a printable one-page guide, check whether body text is legible at the actual printed size rather than on a zoomed-out design preview. A hierarchy is more useful than a collection of matching decorative stickers.
Accessible color and contrast
Do not communicate an essential distinction with color alone. A red and green diagram may be ambiguous to readers with some color-vision differences or when printed in grayscale. Pair colors with labels, shapes, icons or different line styles. The W3C guidance on text contrast describes minimum contrast requirements for accessible digital text, with exceptions and different thresholds for large text. Contrast ratios depend on the actual colors and context, so do not call a document fully accessible simply because it has dark headings.
Provide real text alternatives for charts
If a chart communicates a numerical trend, write a text description that conveys the relevant values and relationship. “A chart about test scores” does not help someone understand a rise from 62 to 78 points or a comparison between groups. For a complex visual, a longer nearby explanation or accessible data table may be necessary. The W3C's text-alternative technique describes the role of a short description and associated long description. The point is to preserve the information, not just label the file as an image.
Do not turn an AI illustration into scientific evidence
Image generators can draw convincing anatomy, physics setups, historical scenes and statistical graphs while placing details incorrectly. Treat such images as drafts or decorative material until facts are verified against reliable course sources. An anatomical diagram with the wrong label is worse than a plain, correct table when someone is studying for an exam. If an AI model produces a diagram, inspect the concepts, proportions, legends, numbers and units carefully. If the assignment restricts AI-generated images, follow the course policy rather than trying to hide their origin.
Worked example: a small revision timeline
Imagine a fictional history assignment requiring students to explain four events: a proposed law in 2001, a public debate in 2002, a revision in 2004 and an evaluation in 2006. These events are invented teaching placeholders, not historical facts. A useful timeline would keep the years spaced according to elapsed time and pair each event with one short explanation of how it connects to the next. A poor version might place all points equally spaced despite time gaps or use decorative arrows that imply a causal relationship the sources do not prove. Confirm actual dates in genuine source materials before publication.
Make a complete mini-guide from a small dataset
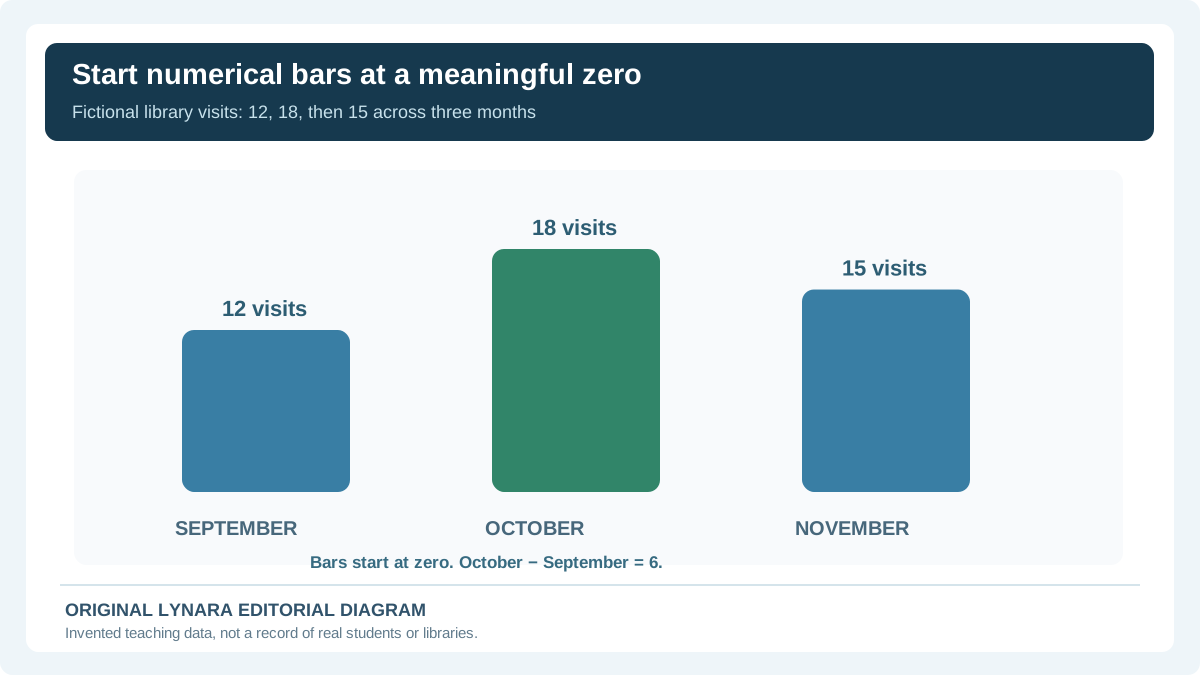
Suppose the lesson objective is to read a chart accurately without inventing a cause. Start with this fictional classroom dataset rather than asking an image model to draw an unexplained graph. Imagine that a student counted library visits during three months:
| Month | Visits counted | What you can say |
|---|---|---|
| September | 12 | Starting count for this example. |
| October | 18 | Six more visits than September. |
| November | 15 | Three fewer than October, but still above September. |
Your guide could show three bars starting at zero, with the numbers printed next to them and a title specifying that these are fictional counted visits. Pair that graphic with a meaningful text alternative: “Monthly example counts are September 12, October 18 and November 15; October is the highest, and November remains three above September.” That description preserves the important information if the chart is not visible.
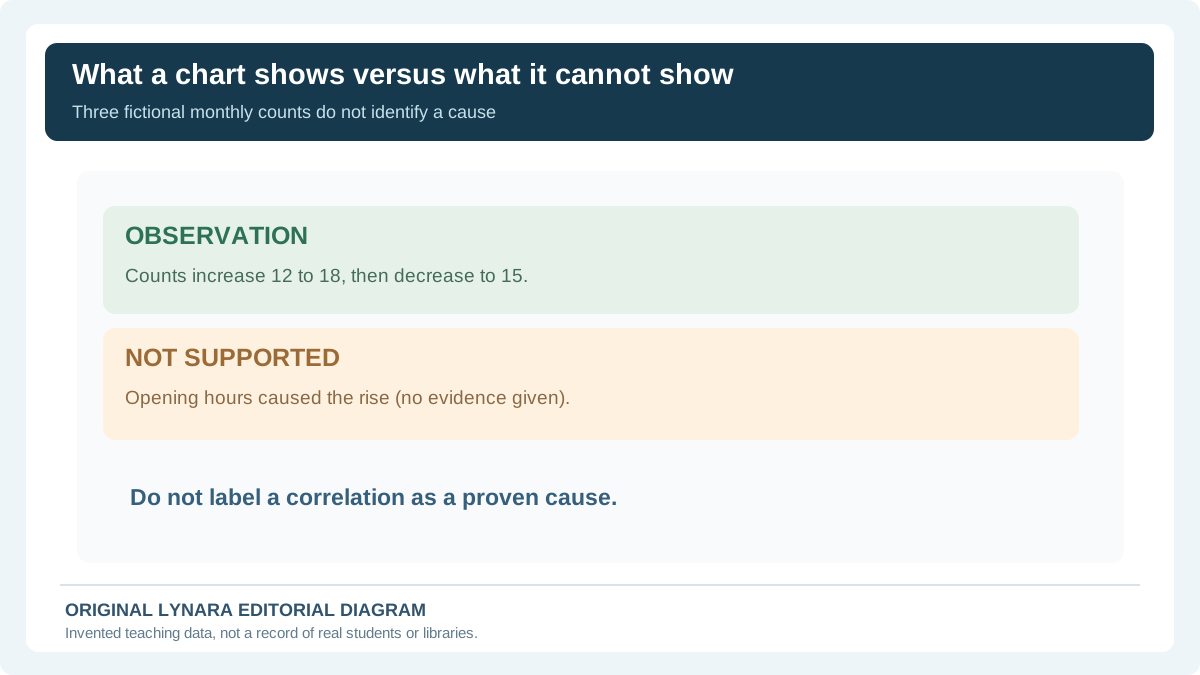
Now cover the table and answer two questions: (1) How much higher is October than September? (2) Do these numbers prove that longer opening hours caused the rise? The answers are six visits and no; the example gives no information about opening hours or other possible explanations. If you missed either, revise the guide's labels and explanation, then try again later without looking.
This example is a teaching exercise, not a report of visits at a real library. It also shows why the Chart Axis and Denominator Checker belongs next to numerical study graphics: a plausible-looking chart still needs a defensible scale and readable values.
Infographics versus retrieval practice
An infographic often helps a student understand organization, but familiarity with a picture can be mistaken for mastery. After studying, convert the graphic into questions and answer without looking. Our Study Tools Hub can help where the available tool supports creating review cards; otherwise use the Study Tools Hub to choose an appropriate active-recall workflow under your course rules. Avoid presenting an image as a replacement for retrieval practice and source checking. The visual should make relationships clear; practice should test whether the learner can recall and use them.
Compare data honestly
A simple bar chart can distort the apparent size of a difference when its scale is cut without explanation. Our Research Chart Axis and Denominator Checker provides a transparent calculation for two supplied values, a displayed baseline and separate group denominators. Link to it when the study guide includes data. Use real axes, units and source labels rather than copying a beautiful but inaccurate graph from a social post. A scientific visualization should be interpretable without relying entirely on color or an ambiguous legend.
Make printed and mobile versions work
A guide that looks great on a large screen may become unreadable when printed in grayscale or opened on a phone. Review one-column stacking, minimum text sizes, margins and whether horizontal diagrams need an alternate vertical explanation. Exporting text as a single flattened image can make selection, search and screen-reader use harder. When possible, keep real text as text and use images for genuine visual structure. If the task requires a printable file, inspect the PDF or print preview rather than assuming the on-screen layout is equivalent.
What to cite on a study guide
A timeline with dates, an anatomy figure, a mathematical result and a summarized research claim should link back to the source that supports them. An image or infographic itself may also have permissions and attribution requirements. Use our Citation Generators for formatting accurately gathered publication details; do not invent a book or article merely to populate a credit line. If several visual panels rely on different sources, make the references traceable to the panels rather than hiding every citation in a single unlabeled footer.
A small quality check before sharing
Ask another student to follow the page without you explaining it. Can they identify the learning objective, read every important value, understand the color conventions and answer the intended practice questions? Test it in grayscale and at real mobile and print sizes. Then check each number and label against the original class material. Our AI Claim Verification Tracker can help record what still needs independent checking. A good visual revision guide is useful because its explanations are accurate, navigable and memorable—not because it uses the most elaborate image-generation prompt.
Visual revision quality checklist with a concrete example
Imagine the objective is to compare the structure of three fictional research methods. A useful comparison chart might use columns for the method, what evidence it records and what it cannot establish. The image must remain readable at the intended display size, and the key distinctions should appear as text rather than only as blue, yellow or red boxes. Do not assume a color-blind reader can distinguish the labels by hue.
A student can then create a simple active-recall exercise: hide the “limitations” column and explain each method's weakness from memory. Open the table again and verify the response. For a scientific timeline, perform a second check: are dates correctly spaced, and does an arrow accidentally imply causation? For a data chart, confirm the original units and denominators with our Chart Axis and Denominator Checker before choosing colors or symbols.
Test the finished guide in grayscale at phone width, and try keyboard navigation if it is delivered as a website. For a printed handout, inspect an actual one-page print preview. The goal is not to make every student's learning style visually identical; it is to make the information clear, accessible, evidence-based and useful for answering questions independently.
Make a chart that still works without the image
Use the fictional library counts already introduced: September 12, October 18 and November 15. A simple bar chart with a baseline of zero can communicate the actual difference more fairly than a chart whose axis begins at eleven. The three values have the same unit—counted visits—and need labels the learner can read without relying on the colors alone. Add nearby HTML text saying exactly what the bars show: October has six more visits than September; November has three fewer than October and three more than September. Those are arithmetic descriptions, not claims about causes.
| Month | Counted visits | Change versus earlier month |
|---|---|---|
| September | 12 | Baseline |
| October | 18 | +6 |
| November | 15 | −3 |
The table matters for screen-reader users, for printouts where colors may be lost and for anyone who wants to check a calculation. Avoid labeling October's growth as caused by extended opening hours: no opening-hour data appears in this exercise. Even a correctly scaled chart cannot establish cause and effect by itself. If the real lesson concerns causal inference, add a separate question asking what further evidence would be required before drawing that conclusion.
Use a five-part publication check for every visual
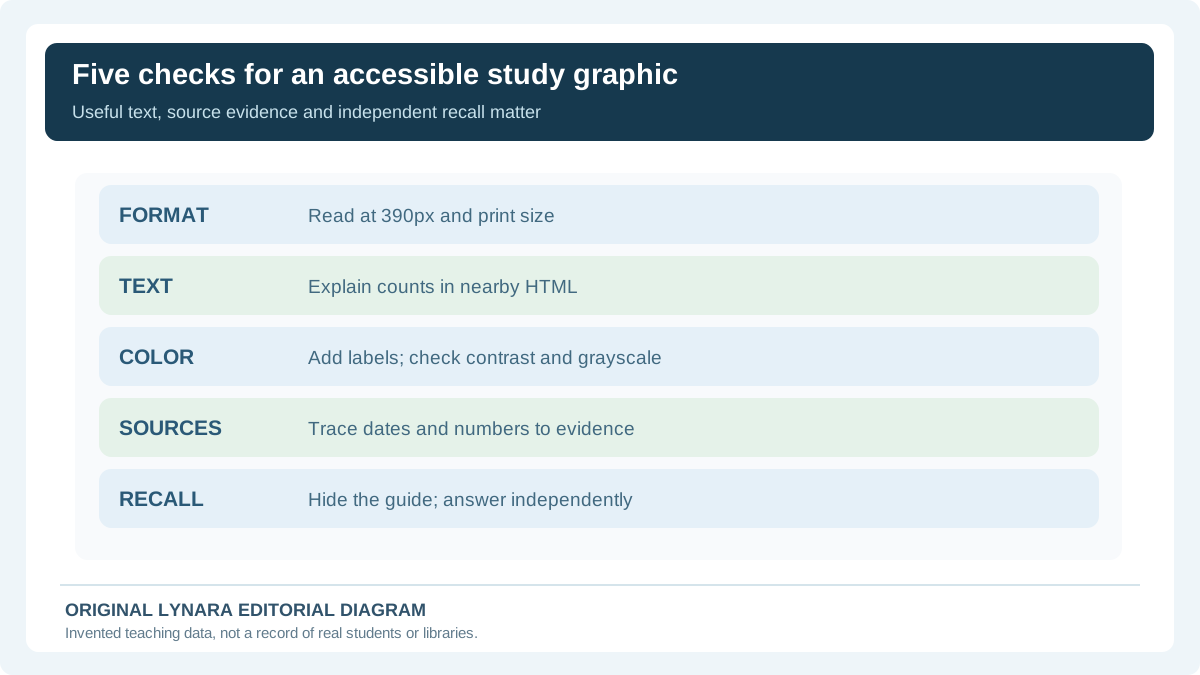
Before showing a scientific infographic to classmates, check its intended physical and digital formats. A graphic that is readable at 1,200 pixels wide might fail as a miniature on a phone. Read every label at the target device size and inspect the printed version rather than assuming a software preview guarantees legibility. Keep essential explanation in ordinary selectable text when possible, because flattening paragraphs into a graphic reduces flexibility for zooming and assistive technology.
Second, verify data and labels against the original assignment source. Third, test whether distinctions survive grayscale and do not rely on color alone. For ordinary text, the W3C WCAG 2.2 explanation of contrast states the usual 4.5:1 threshold and 3:1 for large text, subject to its exceptions; checking contrast does not by itself establish full accessibility. Fourth, add a short alt description that conveys the image's purpose and more detailed nearby text or a table for complex numerical data, consistent with W3C Technique G95. Fifth, hide the finished visual and attempt two unseen retrieval questions. If the student cannot explain the chart unaided, improve the lesson and practice rather than polishing decoration.
A practical GO/HOLD decision is more useful than an aesthetic rating: GO only if the graphic is factually correct, readable in its intended format, understandable without color-only meaning, backed by actual sources and usable for recall. HOLD when an image generator invents a measurement, an inaccessible screenshot is the only source of data, or the prompt is from a course that does not permit AI-produced artwork. The Chart Axis and Denominator Checker can help frame specific numerical risks, but cannot certify the diagram as accurate or accessible without human review.