AI Presentation Makers for Students: Canva vs. Copilot
Generating slides is easy. Making a credible, readable presentation that a student can actually deliver requires a more careful workflow.
Decide what the audience should learn before opening a generator
Students often ask an AI presentation maker to produce ten slides on a broad topic and then spend most of their remaining time deleting repeated points. Starting with the assignment question is more efficient. Identify what the audience should understand after the talk, which sources support the main claims, how long the presentation must last and which parts need images or diagrams. A five-minute explanation requires a different structure from a fifteen-minute research presentation. Slide count alone is not a learning goal. Write a one-sentence thesis and three supporting messages before generating anything. For a presentation on renewable energy, for example, those might cover how the chosen technology works, a measured advantage and an important limitation. The student then selects evidence for each message. An AI tool can suggest an outline, but it cannot decide that a cited statistic is true merely by placing it inside an attractive design. This preparation also makes the later generation prompt much more specific, reducing rounds of revision.
Canva Magic Design: design-first slide creation
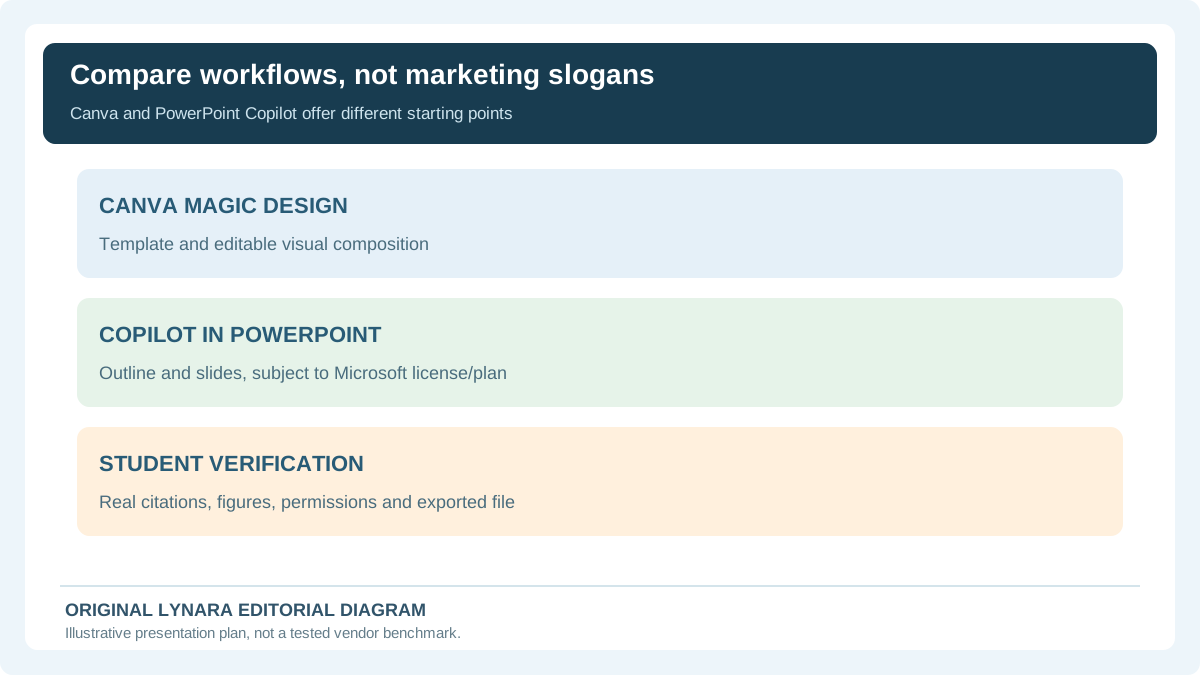
Canva's Magic Design documentation describes starting a presentation with a prompt and selecting a generated visual direction that remains editable in its design environment. That can suit students whose main difficulty is layout: consistent headings, placement of illustrations and slide appearance. The system can provide a starting deck rather than leaving the learner with blank slides. Features and account availability should be verified on the current product page, especially for school-managed accounts. A visual template does not establish an argument. If the first draft includes five decorative slides but omits the assignment's required comparison, the student should add the comparison rather than trying to disguise the omission with more design effects. Check image licenses, attribution and use restrictions, even where the presentation software supplies media. A strong use of Canva is to assemble and refine a presentation from verified facts; a weak use is to treat a generated visual narrative as evidence that the topic has been researched.
Copilot in PowerPoint: useful when the work already exists
Microsoft documents Copilot in PowerPoint as able to draft slide material with reference to files in supported configurations. Its FAQ also explains that capabilities depend on license, application and account settings. This may be attractive for students who have already written a report or gathered approved source material. The generator can save layout time by turning part of an existing document into a proposed slide, although the student must inspect what was selected and what was left out. A document-to-slides workflow is not always better than starting with a brief. Reports contain detail that does not belong on a projection screen. Ask for one core idea per slide, a concise explanation and a clear place for evidence. Verify that quoted figures, dates and definitions survived the conversion accurately. If a paragraph describing two opposing findings is simplified into one claim, restore the nuance before presenting. Copilot features should never be described as universally included in free PowerPoint accounts.
Choosing a presentation maker with a fair test
Rather than trust an unexplained ranking, create the same permitted trial deck in two tools. Give both a small outline with three main points, one short quotation that has already been verified and instructions to leave room for an image. Then measure how much manual work is required to reach a usable result. Check whether the export has editable text, whether it preserves headings, and whether a slide looks readable in projector conditions. Note if the tool made factual additions not present in the source. A useful comparison table could include time to first draft, time spent correcting factual claims, editability, accessible font sizes, export quality and any licensing or payment restrictions. No single criterion decides every project. A graphic-design assignment may reward an ambitious visual treatment, while a science report may demand precise charts and citations. The best choice is whichever process allows the learner to produce a defendable deck with the least unnecessary rework. This method is suggested evaluation practice, not a performance benchmark carried out by Lynara.
A worked five-minute talk: plan the time before the slides
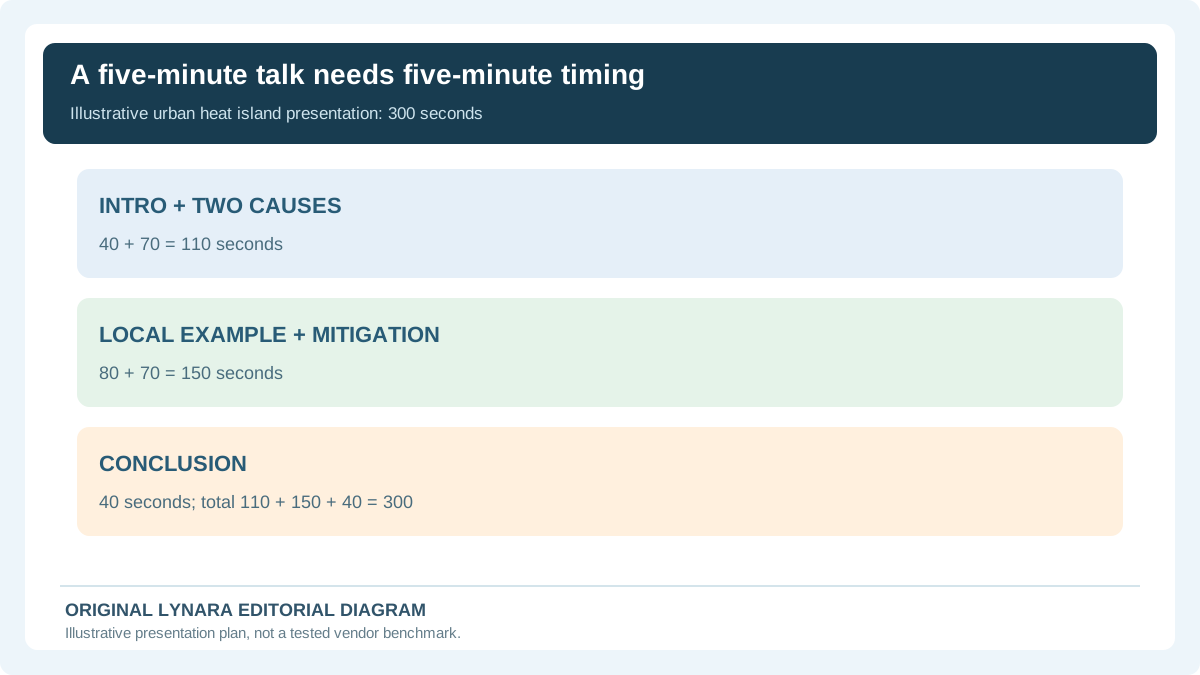
Imagine a student preparing a five-minute talk about urban heat islands. The assignment asks for a definition, two causes, one local example and a possible mitigation strategy. A reasonable illustrative outline allocates 40 seconds to context, 70 seconds to causes, 80 seconds to the example, 70 seconds to mitigation and 40 seconds to the conclusion. Those segments add up to 300 seconds. The student should test them aloud because speaking speed and transitions will vary. If each segment needs one main slide, the deck might contain five content slides plus an appropriately handled source list. The generator should not add ten extra topic slides simply because it can. For the local example, use an authentic map or verified dataset if a geographic claim is required, rather than creating a realistic-looking fictional satellite image. Ask AI for layout alternatives and draft headings, then replace unverified specifics with researched evidence. The exact slide count can change, but the required arguments and time budget should remain traceable.
Slides are not the same thing as speaker notes
A slide crowded with paragraphs becomes difficult to read while the speaker talks. Use short labels or phrases to orient the audience and keep the full argument in speaker notes or a separate script. If a generated slide repeats every sentence of the report, edit it down. However, do not delete essential qualifications such as the date, unit or geographical scope of a statistic. A clean graph that hides its sample size may communicate less truth than a slightly more detailed one. If the draft slide uses a truncated axis, the research chart-axis checker can help explain the visual exaggeration; it cannot certify the underlying values or missing sample size. Ask the tool to separate what should appear visually from what the presenter needs to say. A simple table might include slide purpose, key message, visual element and verbal explanation. Write a transition between slides so the presentation does not feel like a collection of disconnected posters. Rehearsal matters: a student should be able to explain the material without reading an AI-produced monologue verbatim. If they cannot defend a displayed claim, remove or research it rather than depending on confident phrasing.
Source checking and AI-generated images
A generated image can be useful for illustrating an imaginary classroom or an abstract idea, but it is not evidence of a real measurement, historical event or place. Generated diagrams may have incorrect anatomy, numbers or labels. When accuracy matters, obtain a legitimate source image or verify every element independently and add labels manually. Use captions to distinguish creative illustration from authentic documents. Also examine whether the chosen image is accessible and does not rely solely on tiny text or subtle color differences. For statistics, include units, time period, provenance and the correct visual scale. If AI invents a chart from a prompt, it may choose an appealing pattern that does not match the underlying data. A better workflow is to create or verify the numerical chart using an appropriate calculator or spreadsheet, then place that verified chart into the slide layout. Our statistics calculators can help check selected calculations, but they do not authenticate a dataset. The principle is to keep visual polish separate from factual validity.
Accessibility and academic disclosure
Check the deck at realistic projection size. Text that looks large on a laptop may be difficult to read in a classroom. Use clear headings, sufficient contrast and direct labeling. Important information should not be encoded only by color or conveyed solely through a decorative image. Where accessibility features are available, review alt text and reading order. Automatic alt descriptions can be incomplete or misleading, so edit them to explain the actual educational purpose of a meaningful graphic. Follow school policy about AI-generated text and images. Some assignments allow help with planning and visual design but require students to write their own argument; others may allow broader assistance with disclosure. Ask which rule applies rather than assuming any tool's terms override the teacher's directions. Avoid uploading classmates' private data or assessment files to an external system without permission. A student should be able to tell an instructor which parts were drafted or generated and which facts were independently verified.
Finish with a rehearsal and a checklist
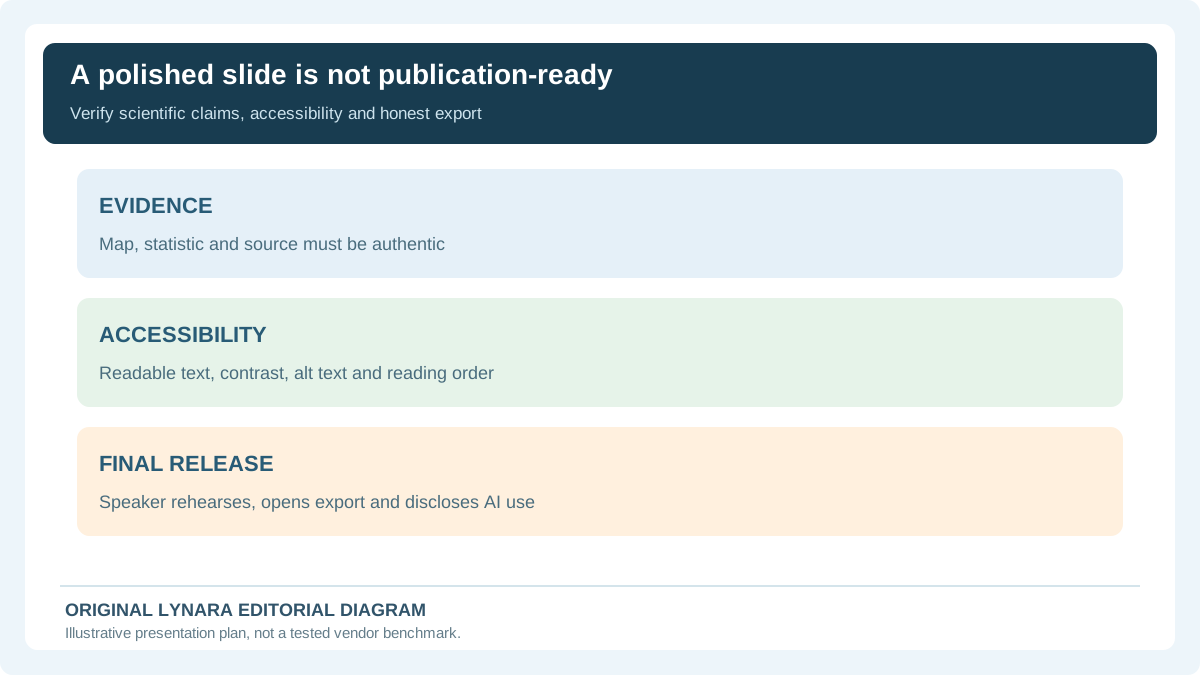
A presentation is only finished when its speaker can use it. Rehearse the entire talk without pausing to search for missing explanations, then check timing and transitions. If the talk runs over, trim repeated ideas before removing evidence that makes a claim understandable. If it is too short, add meaningful explanation rather than another decorative slide. Confirm links and media work in the final exported format and that an offline copy is available if the classroom network is unreliable. The final checklist is straightforward: clear thesis, required content present, verifiable evidence, readable slides, cited sources, correct length, editable and accessible visuals, and a confident explanation in the student's own words. AI can speed up outline and design work, but it should not create a false appearance of research. For writing and revision, use Lynara's academic writing tools, and for source formatting consult the citation library. A good presentation maker shortens production time without concealing gaps in the underlying knowledge.
Use the same verified brief to compare slide makers fairly
For a fictional five-minute talk on urban heat islands, the brief calls for a definition, two causes, one genuine local example and one feasible mitigation idea. Give each presentation maker the same permitted outline, source list and requirements for editable text. In Canva's Magic Design documentation, Canva describes using text, imagery and ideas to produce customizable layouts and templates. Microsoft's PowerPoint Copilot FAQ describes presentation drafting and transforming an existing document, but its available features depend on license and product version. Microsoft explicitly cautions that generated content can be inaccurate or inappropriate. Do not claim both products have identical functionality or that this article measured which one wins.
| Criterion | How the student checks it | Fail condition |
|---|---|---|
| Evidence | Every quantitative or geographic claim has a genuine opened source | Fabricated citation or synthetic map posing as data |
| Editability | Text remains editable in required submission format | Flattened image of text that cannot be corrected |
| Accessibility | Readable projected text, meaningful alt, clear reading order | Low contrast or tiny illegible captions |
| Practical workload | Record draft, correction, verification and export time | Only prompt time is counted |
The invented speaking budget is 40 seconds introduction, 70 causes, 80 local example, 70 mitigation and 40 conclusion, or 300 seconds. Five minutes is a target, not a scientific prescription for each slide. Rehearse with a real stopwatch. If a generator inserts a sixth argument or an unsupported local statistic, remove it rather than extending the talk or passing it off as verified. If a local environmental example needs an actual map, use an appropriately licensed real source; an aesthetically convincing AI aerial image must not masquerade as a recorded temperature observation.
Check exported files, not just their editor previews. Where meaningful, add concise human-written alt text for informative diagrams and ensure the audience can read chart labels and source notes. Do not upload classmates' private work or school materials to tools that are not approved. Disclose the actual permitted AI help honestly: for instance, layout suggestions and draft headings are not the same as researching a source or producing an authentic scientific measurement. For numerical claims, the Research Chart Axis Checker can help inspect chart scales, but cannot prove source authenticity.
Editorial scope
Provider features are attributed to their own linked documentation; examples are illustrative rather than first-hand performance tests. Verify your school's rules, source material and privacy requirements. See Lynara editorial policy.