AI Image Prompts for Learning: Verified Diagrams and Examples
Make educational graphics with accurate captions and editable labels, instead of expecting a model to supply factual diagrams by itself.
Begin with a learning objective, not an image style
Students sometimes open an image generator with a broad request such as make a cool science illustration. The resulting picture may look polished, yet communicate almost nothing about the specific concept being assessed. A useful educational image starts with one learning objective: distinguish two processes, identify the parts of a system, compare scale or remember an order of events. Once that goal is clear, composition and style become tools rather than the goal itself. A simple diagram with generous whitespace may support learning better than a cinematic illustration crowded with detail.
For example, a biology class might need students to distinguish diffusion from active transport. The prompt should describe which relationship needs to be visible, while leaving scientific labels to be checked and added afterward. If an image model invents molecular arrows or membrane proteins, attractive design cannot make the science accurate. Write one sentence explaining what the learner should understand after viewing the final figure. If you cannot write that sentence, the prompt is not ready. This reduces time spent revising beautiful but educationally empty outputs.
A prompt has four useful parts
For most school graphics, a practical prompt describes the subject, relationship, composition and constraints. Subject names what should appear. Relationship states what should be compared or connected. Composition determines whether elements are arranged side by side, in a sequence, or in a single focal scene. Constraints ask the system to leave space for manually added text, avoid unrequested objects and use an aspect ratio suitable for the intended slide or handout. This structure gives the tool enough direction without relying on obscure lists of fashionable adjectives.
A sample creative prompt might request a clean, landscape, flat-vector illustration showing two adjacent empty classroom experiment stations, left and right, each with identical glassware positions, neutral background, clear separation, and no letters or numerical markings. That is only the visual foundation. After generating it, the student should insert the real variables, measurements and captions from the experiment record. Asking the image model itself to create the measurements would turn an illustration into potentially fabricated evidence. Constraints around facts are at least as important as constraints around colors.
Copy-ready prompt template and a 15-minute review plan
Use this template when the image is supposed to explain an idea rather than merely fill space: “Create a [format] illustration of [subject] to help a [grade or audience] learner distinguish [relationship]. Arrange [number] visual groups from left to right. Use [viewpoint and shape instructions]. Leave blank space for verified labels. Do not add text, numbers, measured data, maps of real locations, logos or invented citations. Make the groups visually distinguishable without relying on color alone.” Replace the brackets with the assignment requirements. Do not paste student names, private work or a teacher's restricted handout into a third-party service.
For a fictional science lesson about two ways of moving materials across a boundary, the student could request two clearly separated, unlabeled panels with simple circles and arrows, keeping arrows editable outside the image. The student then checks the direction and meaning of each arrow against the assigned textbook before placing labels in a slide editor. If the generator changes the underlying scientific relationship, reject the draft; adding a correct caption cannot repair a fundamentally misleading drawing.
| Field | What to record | Failure to avoid |
|---|---|---|
| Objective | One question the image helps answer | Beautiful but unrelated artwork |
| Relationship | Compare, sequence, location or hierarchy | Arrows that imply false causation |
| Composition | Two panels, clear order, label space | Clutter and unreadable details |
| Evidence | Source for every factual label | Invented measurements and quotations |
| Release | Rights, class policy and accessible text | Unapproved sharing or inaccessible export |
Allocate an illustrative 15-minute check as 3 minutes to state the objective, 4 minutes to inspect the composition, 5 minutes to verify facts against class material and 3 minutes to review the final labels, permission and text alternative. The sum is 3 + 4 + 5 + 3 = 15 minutes. This is a planning example, not a measured time saving or a promise that all diagrams can be verified in fifteen minutes. A complex medical or geographic figure may require a different medium and much more expert review.
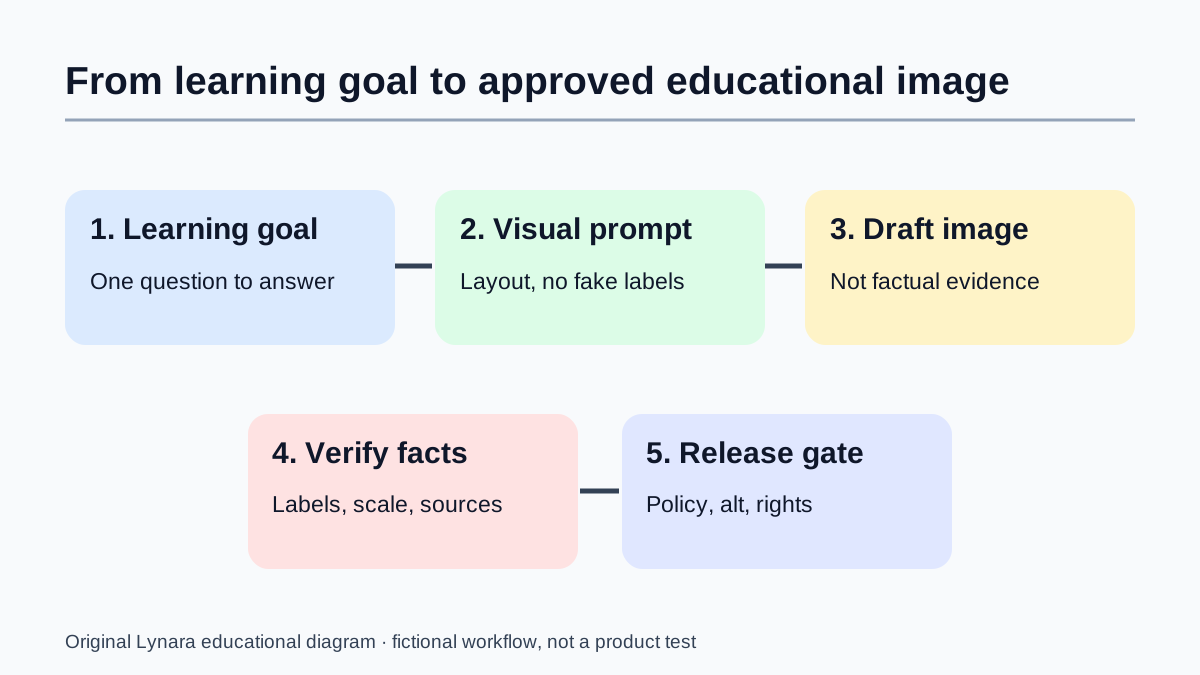
Why it is safer to add labels in a real editor
Generated text within an image can be misspelled, rearranged, inconsistent or difficult to edit. Even when the model produces legible wording, the label may be attached to the wrong part of a diagram. Using a slide editor or graphics application to type final labels gives the student direct control over the exact terms, font size, alignment and accessibility. It also makes it easier to correct a mistaken definition without asking an image model to repaint the entire graphic.
Try splitting the process into layers: generate a visual background or simplified unlabeled diagram, create a separate list of verified labels from course notes, then place those labels manually. If a model has drawn a structure that contradicts the verified source, discard or redesign that part rather than labeling the incorrect drawing anyway. The work can still use generative images; it simply refuses to treat image generation as a factual citation. The result is often easier to maintain when the teacher requests a small correction near the deadline.
A worked prompt revision for a geography presentation
Imagine a student preparing a presentation about a river catchment. Their first prompt asks for an aerial view of a river and hills. The output may be scenic but include tributaries that do not clearly show runoff or drainage boundaries. The second prompt specifies a simplified fictional watershed illustration from above, two hill slopes draining toward a main channel, visible tributary junctions, neutral terrain textures and a blank area for a title. That is more useful because the composition is tied to a concept.
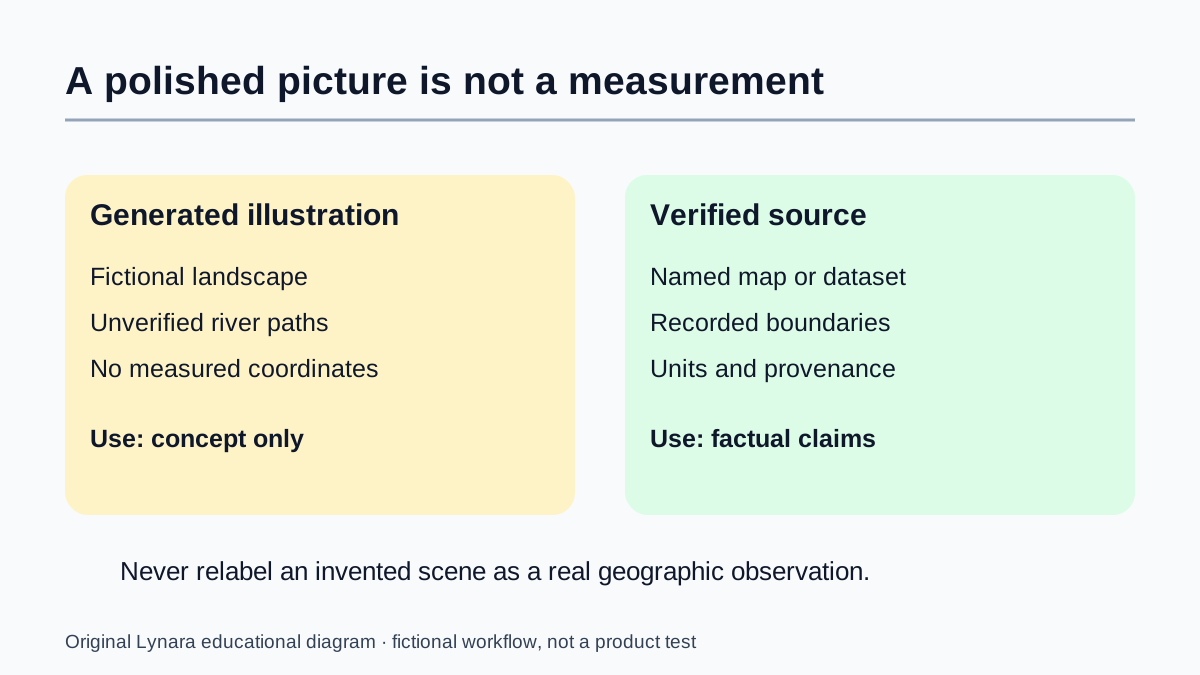
The student should not label the result as a real watershed or infer exact drainage patterns from a generated scene. Instead, they can use it as a clearly identified conceptual illustration, cross-check features against geography sources and add accurate captions outside the image. If a local place must be shown, a legitimate map or verified geographic dataset may be the proper source rather than an invented depiction. Prompt improvement does not make a fictional map geographically correct. The right medium depends on what the audience expects the image to prove.
Choose illustration, real evidence or a hand-drawn chart
A generated illustration is suitable when the assignment needs a conceptual scene: a fictional river catchment, an imagined historical setting or a simplified classroom layout. It is not a replacement for a real map, a photograph of a historical object or measurements from an experiment. If a teacher asks where a particular river changes course, obtain an authoritative map with documented provenance. If the teacher asks how water can flow toward a main channel in a simplified example, a clearly labeled fictional schematic may be useful. The visual medium should follow the claim, not the other way around.
Consider a fictional river lesson. A generated background shows two hills and three tributaries. The student's source notes, however, describe a different number of tributaries. There are three defensible responses: regenerate a generic conceptual scene without asserting a real count, manually redraw a verified schematic from the course source, or switch to a licensed real map if the project requires actual geography. There is no defensible option to keep the mismatch and label it “accurate.” This distinction also applies to anatomy, engineering cross-sections and scientific instruments.
For a chart, start from the original data table rather than a prompt such as “make a graph showing growth.” Suppose a fictional class counted 12 study sessions in week one and 18 in week two. The difference is 6 sessions and the relative increase, using week one as the denominator, is 6 / 12 = 50%. Those numbers are teaching placeholders, not observations from real students. Plot the bars from zero, show units, and write the values as editable text. The Research Chart Axis and Denominator Checker can help inspect a proposed axis and denominator; it cannot validate the original observations.
Make the evidence boundary explicit in the caption. “Fictional illustration of a possible watershed” describes an illustrative draft. “Map of the local river basin in 2026” is a factual claim that needs a real, dated source. Keep the source name, relevant page or dataset version in the project notes. A viewer should be able to tell whether they are seeing an imagined teaching example or independently supported evidence without guessing from the art style.
A different example: illustrating a historical scene
For a literature or history project, students sometimes need atmosphere rather than measured precision. An original illustration of an imagined printing workshop can help communicate a period mood, provided the caption does not pretend it is an authentic photograph or contemporary record. A strong prompt specifies a fictional scene inspired by a broad period, the viewpoint, key objects, lighting and areas to keep uncluttered for presentation text. It should avoid falsely asserting that a named historical person was in a particular room or held an object at a particular event.
The student can then use primary historical sources for factual claims about printing methods or working conditions. If the illustration contains an obvious anachronism, such as equipment invented much later, correct it or remove the image. A useful caption might explain that the visual is a modern illustrative reconstruction and that factual descriptions are drawn from cited material. That separates creativity from evidence. The distinction is especially important when a realistic style makes the invented scene appear documentary.
Test revisions with one changed variable at a time
An effective prompt workflow resembles controlled experimentation more than endless adjective stacking. Begin with one initial prompt and write down what failed: perhaps too many objects, poor empty space or unclear separation between components. Change the relevant part of the request and try again. If you change every instruction at once, you will not know which adjustment improved the outcome. For a classroom slide, a more useful iteration might be to leave thirty percent of the frame empty for a title rather than simply adding the word professional.
Keep a small revision log when the graphic matters: goal, prompt version, visible error and next adjustment. The point is not to produce a publishable machine-learning experiment. It is to stop losing time by repeatedly generating images without learning from the attempts. A student who is already using a presentation editor may find that moving a label manually is faster than another full generation. Choose the smallest change that solves the communication problem. Correctness and readability should come before decorative novelty.
Accessibility is part of the assignment, not an afterthought
A diagram should make sense to the intended audience. Small labels that look attractive on a large desktop monitor may become illegible when projected in a bright classroom. Check final output at the size it will actually be seen. Use sufficient contrast between text and its background, provide an understandable title, and avoid relying on color alone to distinguish categories. Patterns, direct labels and simple shapes can help readers who cannot reliably distinguish every color combination.
If the document requires alt text, describe the educational relationship rather than listing irrelevant artistic details. For example, an alt description might say that two arrows show different directions of material transport across a membrane, if the arrows have been verified for the actual concept. For a fictional decorative scene, concise decorative alt treatment may be appropriate depending on context. The student's job is to ensure that a reader can extract the intended information. AI generation does not automatically create an accessible or accurate finished resource.
Product and privacy checks before uploading reference images
Some tools allow students to upload an existing picture and request changes. Before doing this, verify that you have permission to use the source material and that the intended upload does not contain private student information. A screenshot of a class roster, marked assignment or internal school portal may reveal names or grades that should not be sent to an external service. The same problem applies to identifiable portraits and copyrighted images copied from websites without appropriate permission.
School-managed accounts may restrict which image models are available, what may be uploaded and how outputs can be used. Read the institution's assignment policy and the provider's current terms rather than assuming a personal account operates identically. The ChatGPT image help documents creation and editing options; Gemini's image help describes availability and account restrictions. These are references for current provider behavior, not endorsements of a tool by Lynara.
A final quality check for a learning diagram
Ask five questions before exporting a generated graphic. First, is its learning objective stated clearly in the title or caption? Second, are all factual elements and labels supported by course materials or authoritative references? Third, can a reader follow the diagram without guessing what a color or arrow means? Fourth, is the resolution and text size usable in its final medium? Fifth, have the rules about AI assistance, attribution and source permission been followed? A yes to four of five is not automatically enough if the missing item concerns factual accuracy.
Make the final graphic answer a question rather than merely decorate a slide. One good diagram can be more valuable than a collage of unrelated generated images. A learner can then convert the diagram into a retrieval exercise by hiding labels and attempting to reconstruct them. Lynara's study tools can organize subsequent practice, while the academic writing tools help refine captions. The generator creates a visual draft; the student remains responsible for meaning, evidence and the finished communication.
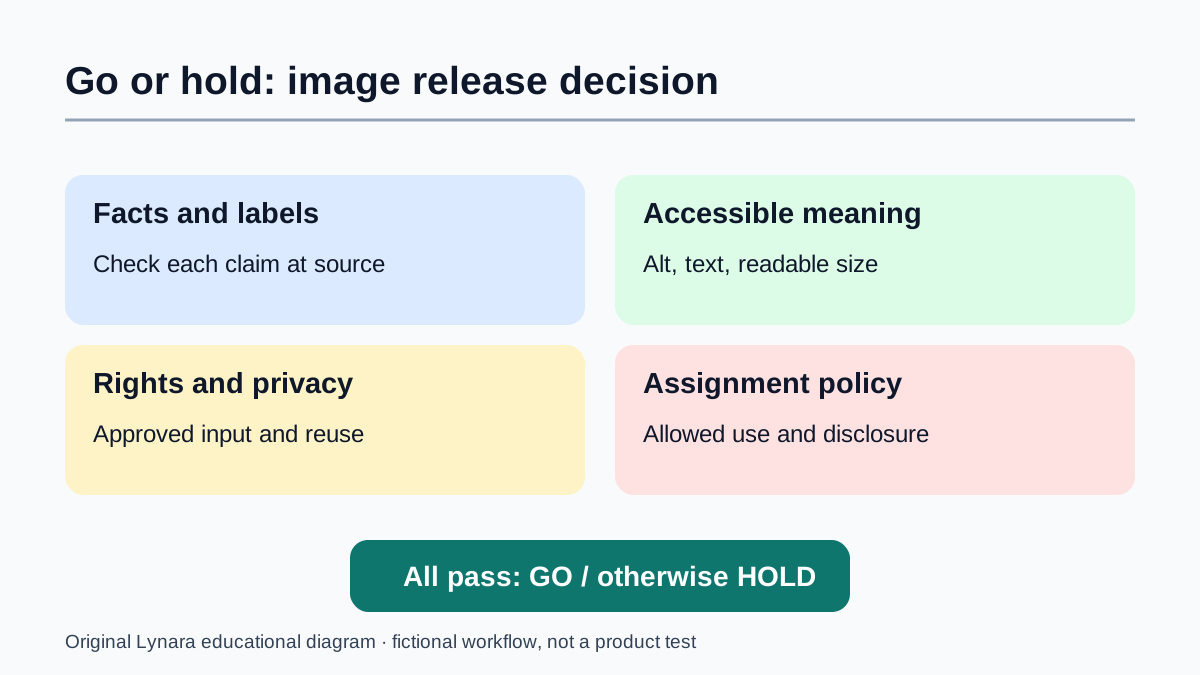
Use a documented GO or HOLD decision before submitting
Make a short release record with four checks: factual accuracy, accessible meaning, input/output rights and the assignment's AI policy. For each check, write GO only when you can name the evidence. Otherwise write HOLD and the next action. A fictional history illustration with an uncertain machine design might be held until the student consults a primary reference. A polished diagram with tiny labels might be held until a phone-size and print check. A class roster accidentally included in a reference screenshot requires stopping the upload and following the school's privacy procedure rather than merely cropping the final picture.
For accessibility, the W3C Images Tutorial explains why the text alternative should convey the image's purpose. The W3C guidance for complex images recommends more complete text equivalents when a short description cannot convey a diagram's details. A meaningful alt description for a two-panel comparison explains what is being compared; a nearby table can carry values and qualifications that would make the alt text too long. Test reading order and keyboard access in the final format where applicable, rather than assuming a correctly written alt attribute solves every accessibility issue.
Rights need their own check. Permission to use a source photograph as an input is different from permission to publish an altered result. Provider terms, classroom policies, privacy obligations and the rights of third parties may all apply. The U.S. Copyright Office's January 2025 report notice explains that copyright protection for AI-assisted work depends on sufficient human authorship; simply writing prompts is not automatically enough. That copyrightability question is separate from whether the student may use the tool or source material. Record the source and the human contributions without claiming a universal legal clearance.
Finally, check the export. Open it on a phone, inspect it at actual presentation or print size, verify that labels are legible, and confirm that captions do not imply fabricated evidence. If any critical check remains unresolved, hold the image and submit a clear text explanation or a verified table instead. For fact claims that still need checking, the AI Claim Verification Tracker offers a place to record the question, source and decision. The release decision should be explainable to a teacher or teammate without access to the original chat with the image model.
Editorial note
The prompt examples are instructional scenarios, not claims of tests performed against provider products. Verify scientific and historical information from original sources. Review our editorial standards.